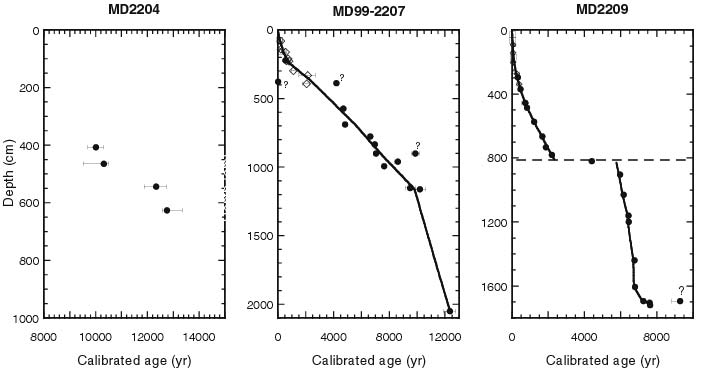
| Figure 6.1. Plot of age against depth for cores MD99-2204, -2207, and -2209. Solid circles are the radiocarbon ages and errors given in Table 1. Other symbols (open) are other data or radiocarbon data from other cores at the same site. Diamonds, radiocarbon ages on carbonate from other cores (S. Colman, unpublished data); squares, 210Pb data (A. Zimmerman, unpublished data; Cronin and others, 2000); triangles, depth of agricultural horizon (Willard and Korejwo, this volume, Chapter 7; Cronin and others, 2000). Solid line is a weighted local least-squares fit to all the data shown without queries. |
TO RETURN TO REPORT, CLOSE THIS WINDOW.
U.S. Department of Interior, U.S. Geological Survey
URL of this page: https://pubs.usgs.gov/openfile/of00-306/chapter6/fig6-1.html
Maintained by: Eastern Publications Group Web Team
Last modified: 03.29.01 (krw)