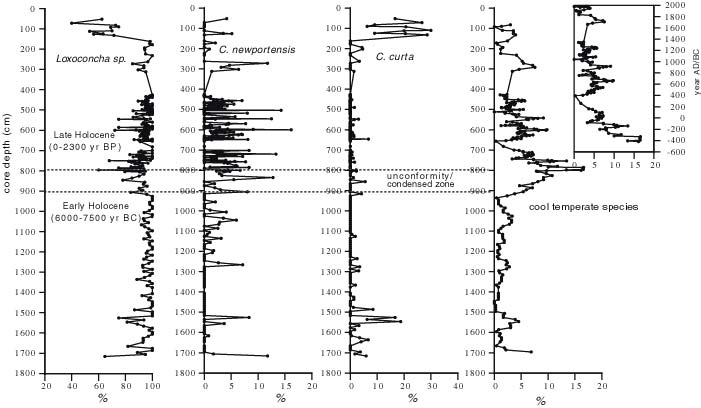
| Figure 9.2. Plot showing relative frequencies of Holocene ostracodes from Marion-Dufresne core MD99-2209. Left, and 2 center plots show Loxoconcha sp. and Cytheromorpha newportensis, the most dominant ostracodes in the deep channel of Chesapeake Bay, decline in the upper 300 to 150 cm coincident with a sharp rise in Cytheromorpha curta. These changes are attributed to the impact on sedimentation and dissolved oxygen from human land use changes in the watershed. At right and inset, cool temperate species are rare during the early Holocene (1700-900 cm), reach a peak in mid Holocene condensed zone (900-800 cm) and progressively decline during the late Holocene. |
TO RETURN TO REPORT, CLOSE THIS WINDOW.
U.S. Department of Interior, U.S. Geological Survey
URL of this page: https://pubs.usgs.gov/openfile/of00-306/chapter9/fig9-2.html
Maintained by: Eastern Publications Group Web Team
Last modified: 03.30.01 (krw)