
Photographs of the Sea Floor
in Western Massachusetts Bay, Offshore of Boston,
Massachusetts,
July, 1999.
U.S. Geological Survey Open-File Report 00-427
Benjamin T. Gutierrez, Bradford Butman, and Dann S. Blackwood
Introduction
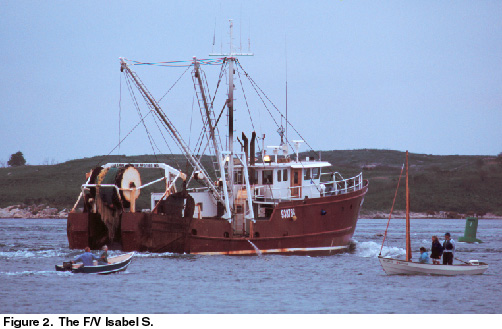
This CD-ROM contains photographs and sediment sample
analyses of the sea floor obtained at 142 sites in western Massachusetts
Bay (Figure 1) during a research cruise
(USGS cruise ISBL99024) aboard the Fishing Vessel (FV) Isabel S. (Figure
2) conducted July 18-21, 1999. These photographs and samples
provide critical ground truth information for the interpretation of shaded
relief and backscatter intensity maps created using data collected with
a multibeam echo sounder system (Butman and others, in press, a, b, c;
Valentine and others, in press, a, b, c). Collection of these photographs
and samples was undertaken in support of a large project whose overall
objective is to map and describe the sea floor of Massachusetts Bay.
The bottom photographs on this CD-ROM may be viewed and accessed via a table, using ArcView, or as individual JPEG images.
I. Using Table 1
Table 1 is organized by quadrangle number and linked to station pages that contain the photographs obtained at each station. Figure 1 shows the station locations for each quadrangle. Each station page contains the station location and thumbnails of the bottom photos taken at each station. The sediment grain size analysis results are also summarized in a table at the bottom of the page. The lack of sediment results table in a particular station web page indicates that a sediment sample was not taken or recovered at that station. To view thumbnails of the pictures, click on the desired station number in Table 1. To view a larger image of each picture, click on the desired thumbnail within each station page.
II. Using ArcView 3.2 (or higher)
The locations of the photos may be viewed over a shaded relief or backscatter intensity image of Massachusetts Bay using ArcView 3.2 or higher. Using ArcView allows the user to zoom to see the location of the images in relation to each other, and sea floor properties. The ArcView project file "wmb_seds.apr" is located in the mbaygis directory, found in the top-level directory of this CD-ROM. The images can be viewed from within the ArcView project, "wmb_seds.apr", using a hotlink (highlight the sta_loc.shp theme, select the lightening bolt tool, and click on the yellow station markers individually to bring up thumbnails of the photos at that station. Double click on an image to view a larger version). To ensure that the hotlink mechanism works, the user should refer to the file "Viewing this CD-ROM". Data sources for the Arcview project file are listed in Table 3 (html format, Excel format).
To view the photographs in
this mode, open the "wmb_seds.apr" project file in the directory
"mbaygis".
The locations of the sampling stations (sta_loc.shp), the locations of
each picture (photos.shp), the locations of the grab samples (grabs.shp)
and the video transects (video.shp) are shown for each station. To view
thumbnails of the pictures, make sure that the station location shape file
is highlighted (sta_loc.shp). Then use the hotlink button (lightening bolt)
and click on the desired station location marker on the Arcview map coverage.
To make sure that this works, the bottom tip of the lightening bolt icon
must be positioned over the station marker. This will bring up individual
station pages displaying the thumbnails of all of the photos at this station.
To view a larger image of each picture, click on the picture thumbnail.
Note that the individual photo locations (photos.shp) are not hot-linked,
but the images are in sequential order from the beginning of the transect
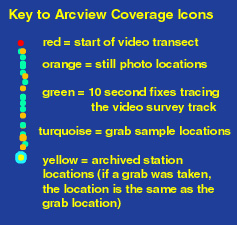
to the end. A guide to the icons that are used to define the different
data locations is included below. In this key the icons that are
used have been enlarged significantly to clarify their meaning.
III. Individual JPEG images
Each photo is stored as a JPEG file in the
folders created for each sampling station. The photo file name is listed
below each thumbnail on each station page. Within each station folder
(found in the "mb_pages" folder), a web page called "index.htm" will bring
up a master page for each station. Each may be viewed by bringing
up the image in a web-browser.
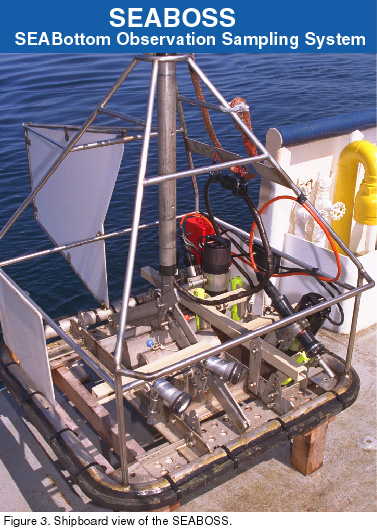
Photographic and sampling system
The bottom photographs presented on this CD-ROM were obtained using a system called Seabottom Observation and Sampling System (SEABOSS,(Blackwood and Parolski, 2000)). This system acquires 35 mm color photographs, continuous color video from both a downward and a forward looking camera, and a sample of the bottom sediment (Figures 3, 4). At each station, the SEABOSS was lowered to a target elevation 76 centimeters (30 inches) above the sea floor. As the ship drifts, typically at a knot or less, bottom video was recorded continuously and individual photographs of the sea floor were triggered remotely based on the video available in real time at the surface. Typically 5-50 still photographs were obtained at each station. At 76 centimeters above the bottom, the still photographs show a 76 x 51 centimeter footprint of the seafloor. At most stations, a single sample of the sediment was obtained, typically at the end of the transect. At some locations, cobbles and boulders on the seafloor made sampling impossible. Sediment was scooped from the top 2-cm of the sampler after the SEABOSS was raised to the surface and submitted for grain size analysis using the methods described in Poppe and others (1985) (Table 2 html format, Excel format).
The still photos were developed and scanned to a
CD as photo-CD files. They were then converted from photo-CD to .jpeg
format in order to reduce space requirements. See the section entitled
"Viewing the Photographs" for a discussion on how to display the photos
on-screen.
The major topographic features of Massachusetts Bay were formed by glacial processes that occurred in several stages. Ice containing rock debris moved across the region, sculpting its surface and depositing sediment, forming the large basins, banks, ridges, and valleys. Other features are the result of processes at work when much of the area was covered with rotting ice, and small valley glaciers and ice falls were active. Ice retreat and marine submergence occurred between 18,000 and 14,000 years Before Present (B.P.), resulting in a high stand of sea level about 33 m above present about 14,000 years B.P. (Oldale and others, 1993). A low stand of sea level about 45 m below present occurred about 12,000 years B.P. as the crust rebounded from ice loading. Today, the surficial sediments and features are reworked and shaped by tidal and storm generated currents that erode and transport sediments from the shallow areas into the deeper basins. Over time, the shallow areas affected by these processes have become coarser as sand and mud are removed and gravel remains, and the deeper basins have been built up as they receive the sand and mud. Knebel and Circe (1995) have identified areas of erosion, sediment reworking, and deposition in this region.
One of the most striking aspects of the sea floor
shown by this survey is the variability in bottom morphology and texture
over scales of a few kilometers or less caused by both natural and anthropogenic
processes. The topography, surface features, and the surficial sediment
texture are results of glacial processes, reworking during the last rise
in sea level, reworking by modern processes, and the disposal of dredged
and other material in this region over the last century.
Shaded Relief and Backscatter Intensity Images
In the Arcview project for this CD-ROM, the locations of the bottom photographs are shown on maps of shaded relief and a map of backscatter intensity draped over shaded relief. Figure 1 also shows the locations overlain on the backscatter intensity map. These maps were compiled from multibeam echo-sounder data collected using a Simrad Subsea EM 1000 Multibeam Echo Sounder (95 kHz) on four cruises aboard the Canadian vessel NGCC Fredrick G. Creed that took place between the fall of 1994 and the fall of 1998.
The shaded relief image was created by vertically exaggerating the topography four times and then artificially illuminating the relief by a light source 45 degrees above the horizon from an azimuth of 350 degrees. In the resulting image, topographic features are enhanced by strong illumination on the northward-facing slopes and by shadows cast on southern slopes. The image also accentuates small features that could not be effectively shown as contours at this scale. Small highs and lows and unnatural looking features or patterns oriented parallel or perpendicular to survey track lines (track lines were run north-south in the eastern portion of the map, northwest-southeast in the southern part, and northeast-southwest in the western portion) are artifacts of data collection and environmental conditions.
Backscatter intensity is a complex measure
caused by the interaction between the texture and composition of the surficial
sediments and of the bottom roughness. In the image shown
here, the backscatter intensity is represented by a suite of eight colors;
red representing high backscatter intensity (rock outcrop or coarse-grained
sediments), blue low backscatter intensity (fine-grained sediments).
These data are draped over the shaded relief image. The resulting
image displays 'light' and 'dark' intensities within each color band that
result from a feature's position with respect to the light source, and
helps to accentuate backscatter changes over the map extent (i.e. strong
illumination, 'light' intensity within a color band, on northern-facing
slopes, and shadows, 'dark' intensity within a color band, cast on the
southern slopes).
See Valentine and others (in press, a, b, c) and
Butman and others (in press a, b, c) for more explanation of the multibeam
echosounder images.
We thank the crew of the Isabel S. for their
work at sea. In addition, Chris Polloni of the U.S. Geological Survey
edited and provided assistance formatting this publication for CD-ROM. Bill
Danforth and Tammie Middleton of the U.S. Geological Survey Woods Hole
Field Center reviewed and suggested improvements to this document.
Blackwood, D. B., and Parolski, K. F., 2000, "Seaboss": an elegantly simple image an sample collecting system (extended abs.): Proceedings, 6th International Conference on Remote Sensing for Marine Environments, Veridian ERIM International, Charleston, S.C., v. 1, p. 99-106.
Butman, B., Hayes, L., Danforth, W.W., and Valentine, P.C., in press a, Sea floor topography of Quadrangle 2 in western Massachusetts Bay offshore of Boston, Massachusetts: U.S. Geologic Survey Geologic Investigations Series Map I-2732-A, scale 1:25,000.
______________, in press b, Shaded relief and sea floor topography of Quadrangle 2 in western Massachusetts Bay offshore of Boston, Massachusetts: U.S. Geological Survey Geologic Investigations Series Map I-2732-B, scale 1:25,000.
_______________, in press c, Backscatter intensity, shaded relief an sea floor topography of Quadrangle 2 in western Massachusetts Bay offshore of Boston, Massachusetts: U.S. Geological Survey Geologic Investigations Series Map I-2732-C, scale 1:25,000.
Butman, B., and Lindsay, J., 1999, A marine GIS library for Massachusetts Bay: focusing on disposal sites, contaminated sediments, and sea floor mapping. U.S. Geological Survey Open File Report 99-439, CD-ROM.
Knebel, H.J., and Circe, R.C., 1995, Seafloor environments within the Boston Harbor - Massachusetts Bay sedimentary system: a regional synthesis, Journal of Coastal Research, 11(1), p. 230-251.
Oldale, R.N., Coleman, S.M., and Jones, G.A., 1993, Radiocarbon ages from two submerged strandline features in the western Gulf of Maine and a sea-level curve for the northeastern Massachusetts Coastal region. Quaternary Research, 40, p. 38-45.
Poppe, L.J., Eliason, A.H., Fredricks, J.J., 1985, APSAS - An Automated Particle Size Analysis System: U.S. Geological Survey Circular 963, 77 p.
Valentine, P.C., Unger, T.S., and Baker, J.L., in press a, Sea floor topography of the Stellwagen Bank National Marine Sanctuary off Boston, Massachusetts: U.S. Geological Survey Geologic Investigations Series Map I-2676-A, scale 1:60,000.
_____________, in press b, Sun-illuminated sea floor topography of the Stellwagen Bank National Marine Sanctuary off Boston, Massachusetts: U.S. Geological Survey Geologic Investigations Series Map I-2676-B, scale 1:60,000.
_____________, in press c, Sun-illuminated sea floor topography and
backscatter intensity of the Stellwagen Bank National Marine Sanctuary
off Boston, Massachusetts: U.S. Geological Survey Geologic Investigations
Series Map I-2676-C, scale 1:60,000.
[an error occurred while processing this directive]