
![]()
Colorado Isostatic Gravity Anomaly Map
![]()
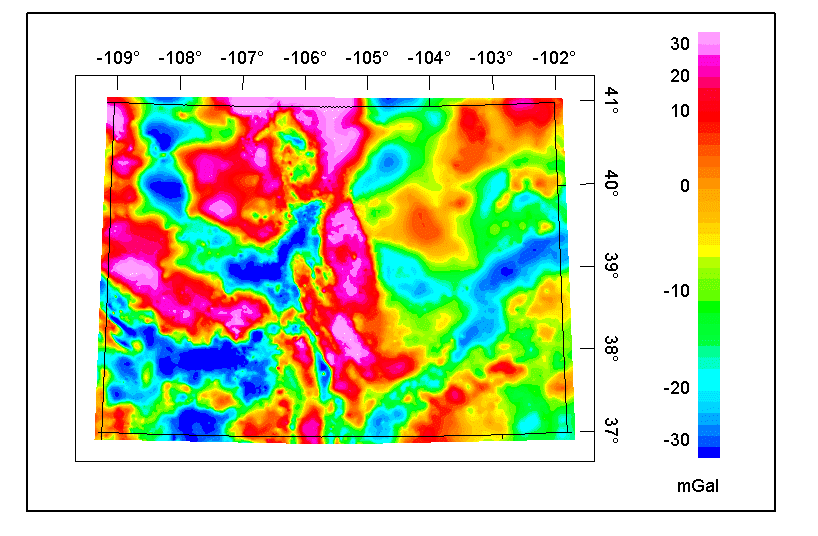
The colors on this isostatic gravity map reflect variations in the Earth's gravity field caused primarily by lateral variations in density in the rocks that make up the upper part of the Earth's crust. An isostatic gravity grid was derived from Bouguer and free-air gravity anomaly data. This grid was created by removing from the Bouguer gravity grid a model of the gravity expression caused by deficiencies in mass (compensating mass) that supports topographic loads. The calculation of the isostatic model used averaged digital topography, a crustal thickness of 30 km, a crustal density of 2.67 g/cc, and a density contrast between the crust and upper mantle of 0.40 g/cc. The features and patterns of the maps reveal details of subsurface geology including the location of buried faults, sedimentary basins, plutons, uplifted basement rocks, etc. Positive anomalies (red colors) delineate rocks denser than the surrounding rocks. Negative anomalies (blue colors) delineate rocks less dense than the surrounding rocks.
Top || Colorado Mag || Crustal Team || Geology || USGS