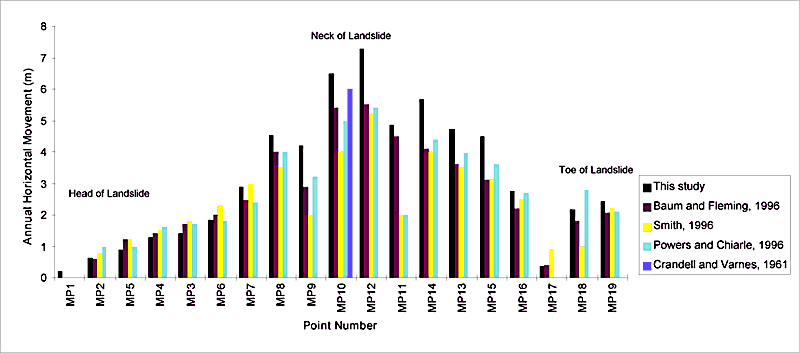
Figure 14. Bar graph showing annual horizontal movement of individual points compared to previous measurements.
U.S. Department of the Interior | U.S. Geological Survey URL: https://pubsdata.usgs.gov/pubs/of/2000/ofr-00-0102/figure14.html Questions or Assistance: USGS Web Contact Page Last Modified: Fri Jan 11 01:36 EDT 2013