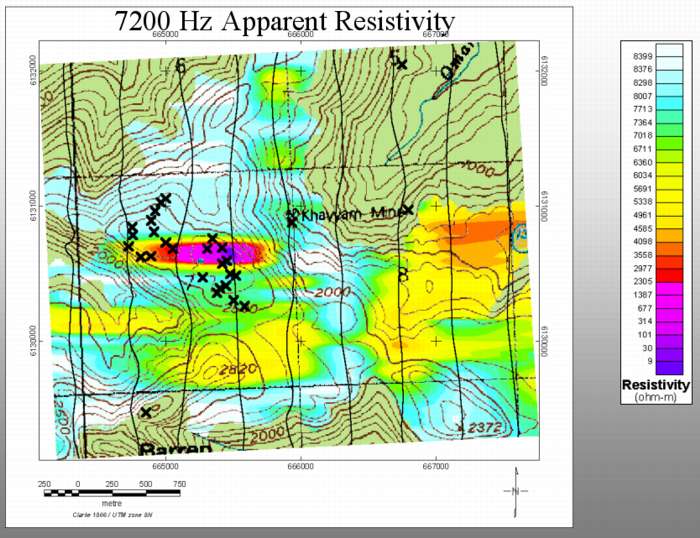
We now focus on the Khayyam area, a prospect worked over and abandoned early in the last century. An obvious resistivity anomaly is shown. The black X's show the location of physical property measurements. The location of the "Khayyam Mine" appears offset from the location of the conductor -- apparently because this is the adit opening leading under the mountain to where the sulfides are located. The adit was buried by snow and was not accessible when we visited.
The point we wish to make here is that the HEM response is directly associated with outcropping sulfide mineralization and or alteration.
Note the less conspicuous anomaly to the east that has a similar shape and size to the Khayyam anomaly. The Stumble On workings are located near the X just to the right of the "Khayyam Mine" label, and represent an outcrop of massive sulfides found there.
A conductivity-depth image (what we like to call a CDI for obvious reasons) is shown using the same color scale. This section depicts electrical resistivity vs. depth along the line highlighted in red. The Khayyam anomaly is a typical "pant leg" style response characteristic of a shallow, narrow conductive body. This section supports the fact that the sulfide mineralization giving rise to this anomaly is very shallow and has only limited depth-extent (e.g., note that the white areas below the topography line are resistive).
Note the Khayyam anomaly is in the 10's of ohm-m range -- this is very conductive when we consider that the HEM system is averaging a large volume of rock.
We will now focus on the area outlined in red to have a look at the physical property data measured on the ground.