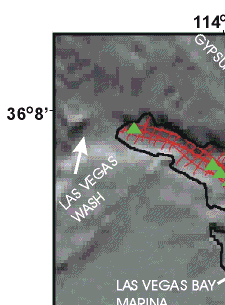
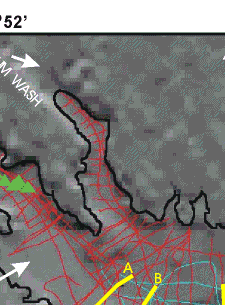
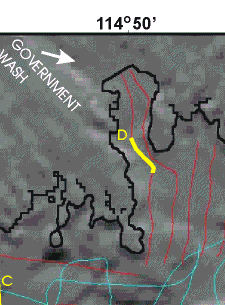
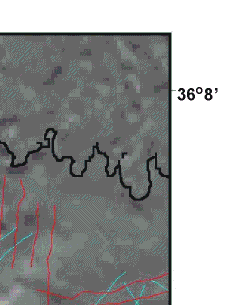
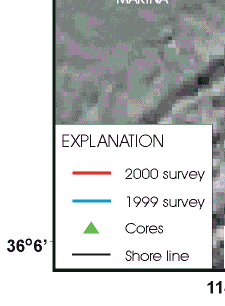
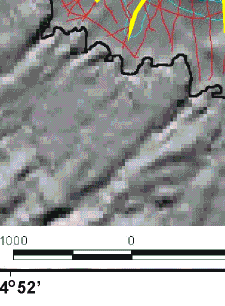
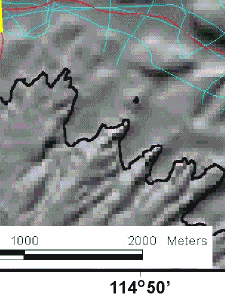
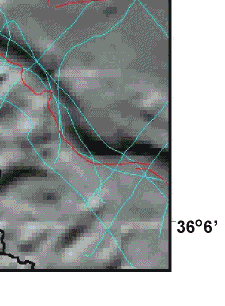
Figure 2. Survey track lines along which sidescan sonar and subbottom seismic-reflection profiles were collected. Red lines are tracks along which data were collected in 2000 and cyan lines are tracks run in 1999. Core locations are shown by black triangles. Yellow lettered lines are locations of profiles shown in Figure 13.
|
|
|
|
|
|
|
|