 Skip navigation links
Aerial Gamma-Ray Surveys in Alaska
by
Joseph S. Duval
U.S. Geological Survey Open-File Report 01-128
Data Processing
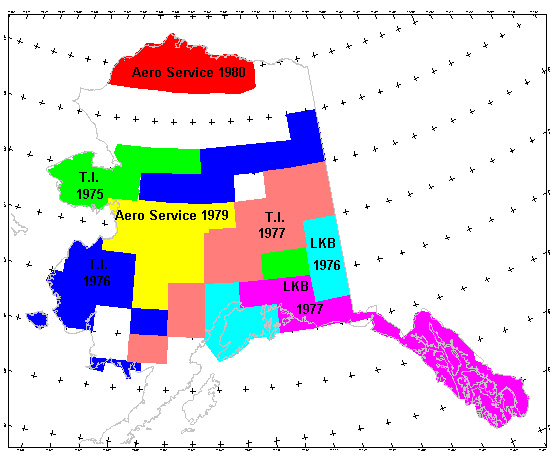
Aero Service refers to Aero Service, Inc., T.I. to Texas Instruments, Inc.,
and LKB to LKB Resources, Inc. You can click on parts of the index map to
view the references for the surveys. The surveys were flown with east-west
flightlines spaced at about 10 km and north-south tie-lines spaced at about 40
km. The nominal survey altitudes were 122 m above the ground with a
detector volume of about 50 L of thallium doped sodium iodide detectors.
The data were corrected by the contractors for aircraft and cosmic background,
altitude variations, Compton scattering, and airborne bismuth-214. Some of
the gamma-ray systems were calibrated such that the data were provided by the
contractors as apparent surface concentrations of potassium, uranium, and
thorium. For the other surveys, the data were provided as counts per
second. The data were processed by the U.S. Geological Survey (USGS) to
convert the count rates to concentration units. This was done by comparing
the data to calibrated surveys and assuming that the conversion only requires
multiplication by a scaling factor. In a similar manner the total count
data were converted to a common scale by assuming that all of the gamma-ray
systems used the same energy threshold for the total count measurement.
For large areas of Alaska, the count rates are very low and the data were often
zero or negative. Zero and negative values were arbitrarily set to a small
value close to zero. Because the count rates decrease at an exponential
rate as the altitude increases, data for altitudes greater than about 250 m
above the ground were set to a dummy value and were not used in the gridding
process. After completion of all corrections, grids of the various data
channels were calculated using a minimum curvature algorithm and a grid cell of
5 km. The latitude and longitude coordinates were projected using an
Albers equal-area conic projection with the Clark 1866 ellipsoid, standard
latitudes of 55 and 65 degrees North, a reference latitude of 0 degrees, and a
reference longitude of 154 degrees West.

|
U.S. Geological Survey, a bureau of the U.S. Department of the Interior https://pubs.usgs.gov/openfile/of01-128/Dataproc.htm Last modified 16-Apr-2001 (jsd) Contact Joe Duval Maintained by the Eastern Publications Group |
|