Digital Mapping Techniques '01 -- Workshop Proceedings
U.S. Geological Survey Open-File Report 01-223
GIS Data Compilation Techniques for Mapping the
Geology of the Fort Polk Region of Louisiana
By R. Hampton Peele and Richard P. McCulloh
Louisiana Geological Survey
Louisiana State University
Baton Rouge, LA 70803
Telephone: (225) 578-5320
Fax: (225) 578-3662
e-mail: hampton@lsu.edu, mccullo@lsu.edu
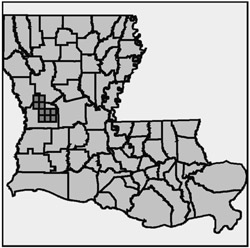
For the map area of the Fort Polk region in western Louisiana (figure 1), the nonalluvial contacts of the surface geology were mapped from field work, at 1:24,000-scale, in the context of previous work; whereas, alluvium, underlying a continuous network of low-relief bottomland landforms, was interpreted principally from topographic maps. Economic geology was mapped from field work; and geologic hazards, comprising only flood zones, were recompiled from Federal Emergency Management Agency data. The surface geology is represented with polygons, except for faults, which are lines in a separate GIS layer. The economic geology is a mixed representation of polygons and points, in separate layers. The geologic hazards are represented with polygons. The study area encompasses the Fort Polk Military Reservation and Peason Ridge Military Installation in west-central Louisiana.
|
|
Figure 1. Study area, western Louisiana.
|
OVERVIEW OF GIS METHODS
Software
The digitizing effort was performed with the Direction Trace Line String function of INTERGRAPH'S GEOVEC software. GEOVEC runs on top of Bentley's MicroStation and INTERGRAPH'S Base Imager; and it employs the MicroStation Feature Collection System. Topology was built, using ESRI's ArcInfo. The final GIS was assembled, within the ESRI ArcView environment.
Process
Intergraph
The initial digitizing effort consisted of three phases:
- Initially, all lines were digitized from scans of the Vellum and Mylar sheets, then smoothed and filtered.
- Circles were placed, as flags, to indicate where digitizing errors had been made.
- Corrections were made where the flags had been placed; and the flags were removed.
Once the digitized lines had been corrected, the line cleaning process began. These tasks were all performed within the INTERGRAPH MGE environment. First, Duplicate Line Processor was run on each file of digitized linework. Duplicate Line Processor eliminates all duplicate lines and breaks all line intersections.
Each quadrangle of digitized linework was georeferenced using the Control Point Setup function of INTERGRAPH's MGE software. All eight control points, at 2.5-minute intervals, were used for each quad as we georeferenced them in the Louisiana ("State Plane") Coordinate System, North Zone, as referenced to the North American Datum (NAD), 1927.
Each digital quad file was converted into the Universal Transverse Mercator coordinate system, as referenced to the World Geodetic System (WGS), 1984, to satisfy the specifications of the U.S. Army Corps of Engineers. For quality assessment of the georeferencing process, we generated a graticule in the UTM coordinate system and overlayed it with the converted files. The graticule was created by using the Grid Generation function of INTERGRAPH's MGE software.
After the alluvium and nonalluvium quads were overlayed, the composite linework was edited to show the alluvium occluding the other surface-geologic units, as it does in reality. Full-scale color plots were made for the geoloGISts to review. The results of the reviews by the geoloGISts were Mylar sheets of both the lines to be added and the lines to be deleted. The lines to be added were digitized, cleaned, georeferenced and overlayed with the alluvium and nonalluvium. Then flags were placed around the digital lines that were to be deleted. After these edits had been made the edgematching process began.
In order to achieve a seamless mosaic we planned to use the graticule, instead of the digitized quad boundaries, for the final GIS geologic quadrangle boundaries. The edgematching process began by creating a new blank design file of the same projection, overlaying it with all of the design files for each of the ten quadrangles, turning on all layers in all files, and performing a fence copy of all the linework into the new blank design file. The linework and the graticule were merged into a mosaic; and edgematching was performed, all using MGE. MGE's End Point Processor was used to flag all dangling ends for the alluvium and nonalluvium layers. All other layers were turned off, including the quad boundaries. And, with the interactive guidance of the geoloGISts, the contacts were manually edgematched.
From this master mosaic design file, only the alluvial and nonalluvial contacts, the faults, and the graticule, for the individual quad areas were fence-copied into ten new UTM, WGS84 design files. After running the Duplicate Line Processor on each of these ten new design files, there were no duplicate lines, and intersections had been broken where the contacts and faults crossed the graticule. Finally, the short segments outside the graticule were deleted from each of these new digital quads, completing the line-development process. The next task was to create topology.
ArcInfo
We used ArcInfo's IGDStoARC translator to translate the final ten INTERGRAPH design files into ArcInfo coverages. We then used the "Build" command in ArcInfo to construct polygon topology from the contact lines. Sometimes the process failed, indicating that some duplicate lines still remained in the digital quad. In such classes, MGE's Duplicate Line Processor was run again on the final design file, before attempting to translate again and build topology.
ArcView
Once polygon topology was constructed for the ArcInfo coverages, they were then translated into ArcView shapefiles, by simply "Adding" them to an ArcView View window and "Converting" them into ArcView shapefiles. The database for each shapefile was populated with attributes within ESRI's ArcView software. After populating the database with geologic-unit abbreviations, we sorted the "Area" field into ascending order, smallest to largest, to facilitate finding any slivers that might exist. These slivers were "Unioned" with adjacent unit polygons, one by one, in ArcView. Finally, customized hues were created in ArcView for each geologic unit type. ArcView could then automatically render all the unit polygons, for each of the ten shapefiles, by reading the unit abbreviations within each shapefile database. After completing the population of the databases with feature attribute records and performing final quality assurance tasks, the data development was complete.
MAP COMPILATION PROCESS
Alluvial Linework
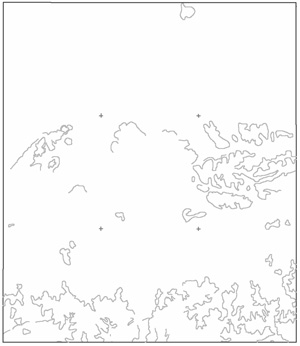
We drew the alluvial linework on Vellum, overlaying USGS 1:24,000 quadrangle maps (figure 2). This technique was a continuation of our methodology from previous non-GIS projects. We completed this component long before completion of the field mapping of the other units.
|
|
Figure 2. Alluvial linework for a quadrangle.
|
Nonalluvial Linework
In the field, we put notes directly on standard topographic quadrangles, corresponding to the localities where we found exposures (figure 3). In the lab, these notes were later inked to increase contrast for photocopying. Then full-size photocopies were made. We color-coded the exposure locations, with highlighting of different colors, to indicate the different geologic units. The nonalluvial polygon boundaries were created by using these highlighted locations to indicate the unit type, while fitting the boundaries to the topography. We then traced these lines, as well as the faults, in different colors, on Mylar (figure 4).
Georeferencing of Data
The alluvium and nonalluvium overlays were formatted with corner ticks, 2.5-minute reference crosses and corners, and quadrangle boundaries, all transferred from the quad sheets. These reference points were later used to georeference the digitized quadrangles.
Merged Nonalluvial and Alluvial Linework
After these formatted hardcopy overlays were manually edgematched and labeled, scans of them were used as source data in the digitizing process. The alluvial and nonalluvial unit boundaries (contacts) were scanned, digitized, and georeferenced separately, then merged in the GIS to create a composite of surface geology polygons (figure 5). Small but numerous subsequent problems deriving from this procedure indicated that manually combining the two layers prior to scanning would have been preferable.
|
|
Figure 5. Composite of alluvial and non-alluvial contacts.
|
Topology and Final Plots
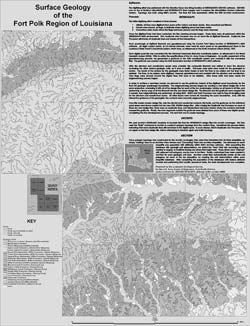
After constructing topology for the polygons, populating the database with geologic-unit attributes and performing final quality assurance tasks, the data development was complete. Finally, we created ArcView layouts for maps-on-demand (figure 6) and FGDC compliant metadata files. A seamless mosaic of all completed maps is shown in figure 7.
REFERENCE
Peele, R. H., and McCulloh, R. P., 2000, GIS data development of the geology of the Fort Polk region of west-central Louisiana, in D.R. Soller, ed., Digital Mapping Techniques '00 -- Workshop Proceedings: U.S. Geological Survey Open-File Report 00-325, p. 119-124, https://pubs.usgs.gov/openfile/of00-325/peele.html.
RETURN TO Contents
National Cooperative Geologic
Mapping Program | Geologic Division |
Open-File Reports
U.S. Department of the Interior, U.S. Geological Survey
URL: https://pubsdata.usgs.gov/pubs/of/2001/of01-223/peele.html
Maintained by David R. Soller
Last modified: 18:24:57 Wed 07 Dec 2016
Privacy statement | General disclaimer | Accessibility