
Digital Mapping Techniques '01 -- Workshop Proceedings
U.S. Geological Survey Open-File Report 01-223
Data Capture Techniques for the Digital Database of the Monterey Quadrangle, California
By David L. Wagner
California Division of Mines and Geology
80-1 K St. MS 12-31
Sacramento, CA 95814
Telephone: (916) 324-7380
Fax: (916) 322-4765
e-mail: dwagner@consrv.ca.gov
INTRODUCTION
At DMT 97 I presented a paper (Wagner, 1997) describing the data capture techniques employed by the California Division of Mines and Geology (CDMG). At that time we were just beginning to work on a digital compilation of a geologic map and database of the Monterey 1:100,000-scale quadrangle and the adjacent seafloor of Monterey Bay. A main point of the paper was that we digitize geologic data for a 1:100,000-scale quadrangle at the largest scale possible, preferably 1:24,000. Now, the compilation has been completed and is undergoing review for release approval. This paper will discuss some of the points put forth at DMT 97.
This map and database are a step forward in the understanding of geology of coastal California. Monterey Bay is a marine sanctuary that has been intensively studied by the Moss Landing Marine Laboratories (MLML), the Monterey Bay Aquarium Research Institute (MBARI) and the U.S. Geological Survey (USGS). As a consequence, the geology and the physiography of Monterey Bay is sufficiently well known to prepare a seamless geologic map of the onshore and offshore. Digital geologic and physiographic data were compiled independently by CDMG, MLML, MBARI, and USGS and integrated into a single database. The Monterey Quadrangle is an example of the benefits of cooperation between research-oriented institutions that emphasize data-gathering activities and a state survey that emphasizes data distribution.
COMPILATION
This project was initiated in 1988 when D. L. Wagner and C. L. Pridmore compiled an analog geologic map of the quadrangle. Compilation of a digital database began in 1998 by digitizing geologic maps at 1:24,000 scale and tiling the maps together to make a seamless 1:100,000 geologic map. Sarah Watkins and Jason Little of the CDMG Regional Geologic and Hazards Mapping Project digitized 28 7.5' quadrangles, mostly at a scale of 1:24,000. Two quadrangles, Monterey and Seaside, already published in digital form by the USGS, were used directly, although the stratigraphic nomenclature was modified slightly for consistency with the rest of the map. H. Gary Greene compiled the offshore geology of the continental slope and Monterey Canyon system, which was digitized by Joseph Bizzarro at the Moss Landing Marine Laboratory. Steve Eittreim interpreted the geology of the continental shelf (water depths less than 150 meters) on screen at a scale of 1:6,000 from acoustic imagery of 2.4 meter resolution. The digital database is in ArcInfo format and employs the ALACARTE data model (Fitzgibbon and Wentworth, 1991).
The base for the Monterey quadrangle consists of a shaded-relief and a topographic map. The topographic base covers only the onshore part of the quadrangle. It is a digital line graph (DLG) of the Monterey and part of the Palo Alto 1:100,000 scale quadrangles provided by C. M. Wentworth (USGS). David Ramsey (USGS) assembled the altitude grid from 30 meter DEMs of the 7.5' quadrangles that make up the Monterey 1:100,000 quadrangle that he downloaded from the USGS database in Sioux Falls. George Saucedo (CDMG) generated the onshore part of the shaded-relief map from a 30-meter digital elevation model (DEM) using the technique described by Haugerud and Greenberg (1998). Norman Maher of the Monterey Bay Aquarium Research Institute (MBARI) prepared the shaded-relief image of the Monterey Bay submarine canyon and surrounding area from Simrad EM300 (30kHz) multibeam bathymetric data collected by MBARI and the USGS. He also provided the bathymetric contours. Steve Eittreim (USGS) provided imagery for the Monterey Bay shelf (water less than 150 deep). That imagery is available online at http://terraweb.wr.usgs.gov/TRS/projects/MontereySonar. Versions of the map with and without the shaded-relief base are included because the gray tones of the shaded-relief darken the lighter-colored tones of the map units. The shaded-relief base map particularly affects the yellow surficial units.
DATA CAPTURE TECHNIQUES
Usually 1:24,000 scale maps are not available for an entire 100K quadrangle so a decision has to be made whether to conduct new geologic mapping or to use existing data at smaller scales. Although approximately one and a half 7.5' quadrangles were mapped as part of the Monterey project, most of the area, both onshore and offshore were covered by good geologic maps, mostly at 1:24,000 scale. Most of the other 1:100,000-scale maps now being prepared by CDMG required substantial new geologic mapping before a compilation could begin. In southern California, a multiyear mapping project, partially supported by the USGS National Cooperative Geologic Mapping Program's STATEMAP component, was conducted to map all of the onshore part of the Oceanside 1:100,000-scale quadrangle. CDMG is now exploring partnership possibilities to upgrade the geologic data on the continental borderland to produce a seamless map covering the offshore as well.
Table 1 shows a comparison of estimates of the time required for tasks in the preparation of a 1:100,000-scale quadrangle made by Wagner (1997) to the time each step actually required in preparation of the Monterey Quadrangle. The time required for digitizing individual 7.5' quadrangles was overestimated by a factor of 3 to 4. Thus the earlier estimate for a single 7.5' quadrangle of about $2280 was clearly too high and is now considered to be about $500 to $700. Part of the overestimation is due to the growing proficiency of the digitizers as they gain experience. Table 1 also demonstrates that while digitizing 7.5' quadrangles is a relatively inexpensive, straightforward process, tiling them together to make a seamless map is not. The main problem here is complexities of matching the geology across map borders (edgematching).
|
Table 1. Comparison of estimates by Wagner (1997) of time required for tasks in compilation of a 1:100,000-scale quadrangle to the time actually spent on the same tasks during compilation of the Monterey quadrangle. The first three steps are the digitization of the individual 1:24.000-scale quadrangles and last two are assembling the quadrangles to produce a seamless map. The edgematch and review steps are iterative, time-consuming tasks that are difficult to quantify. Close collaboration between the geologist/compiler and the digitizer is required for this part of the project.
|
|
Several factors affect edgematching, including: 1) inconsistencies between mappers; 2) inconsistencies in geologic nomenclature; 3) complex geology where there are rapid facies changes and time transgressive units; and 4) scale differences. Inconsistencies between mappers are the most vexing problems facing any compiler of geologic maps. These inconsistencies may arise from scientific perspectives of the mapper, evolution of the understanding of the geology of an area, or the reason why the mapping was done. A map by an academic researcher may have a completely different emphasis than a map prepared by an engineering geologist concerned with the siting of a critical facility. Geologic nomenclature evolves over time and unless a compiler is familiar with how the nomenclature has evolved it may be very difficult to produce a coherent map. As the understanding of geologic relationships evolve, maps portraying the same rock units may be quite different. In California for example, most of the northern and central coastal ranges are underlain by the Franciscan Complex, a tectonically deformed, lithologically diverse collection of rocks now considered to be the type example of a subduction complex. Originally named the Franciscan Formation, mappers labored unsuccessfully for decades to describe it in terms of classical stratigraphic nomenclature. Eventually the Code of Stratigraphic Nomenclature was revised to account for such situations. As a result, newer maps depict the geology much differently than the older ones. Economic interests drove most of the early mapping done in California. Thus until fairly recently, most mapping was done in Tertiary marine terranes in search of hydrocarbons, or in igneous/metamorphic terranes where most mineralized rock occurs. These maps tend to lump most Quaternary units into alluvium and mostly ignore landslides or other features considered superficial. In contrast, mapping today tends to be driven by geologic hazards considerations, engineering applications, land-use, and environmental issues so the superficial features and materials have prominence. Time and effort expended in investigating and resolving inconsistencies before the digital compilation begins can lessen the seemingly endless revisions after the initial compilation is completed.
Prior to beginning the digital compilation, we compiled an analog version of the Monterey Quadrangle that proved invaluable. My experience as a compiler of regional geologic maps (scales of 1:100,000 and smaller) has convinced me that establishing the stratigraphic framework and the preparation of the map explanation requires more time and effort than the preparation of the map itself. Preparation of an analog map is expensive and time consuming but it more than pays off in the long run. It is analogous to a set of plans to guide the construction of a building. The compiler needs to visualize how the pieces are to fit together before the project starts and not have to make midcourse corrections. This however adds at least a year to the project and requires one to two person years of geologist time.
BENEFIT OF DIGITIZING AT THE LARGEST SCALE POSSIBLE
An unfortunate consequence of digitizing geologic maps is that once in digital form, they appear free of scale limitations. In my experience, many users, even professional geologists who should know better, violate the resolution of the data. Regional geologic maps are especially subject to abuse because they cover large areas, even entire states seamlessly. Despite admonitions in readme files and metadata, enlarging from regional scales to site-specific scales is a common practice. A benefit of digitizing and doing all of the edits at 1:24,000 scale is that the 1:100,000-scale map is a mosaic of thirty-two 1:24,000-scale geologic maps. Thus the resolution of the 1:100,000-scale digital compilation will be 1:24,000. It is possible then to enlarge the data to 1:24,000 scale without violating their resolution. It is far more efficient to release a compilation that can be enlarged to 1:24,000 than it is to release 32 individual 7.5' quadrangles.
An example of the utility of this approach was recently demonstrated when CDMG received a request from a sister agency, the Division of Oil, Gas and Geothermal Resources (DOGGR). DOGGR has a program to mitigate the effects of improperly abandoned oil wells that are leaking. They were evaluating old wells in the Sargent Oil field central California Coast Ranges. The Sargent Oil field is on the Monterey 1:100,000 quadrangle and was compiled from several sources at 1:24,000. DOGGR asked CDMG to provide the most up to date geologic map of the area. In a matter of hours we were able to clip out a part of the map at 1:24,000 scale, add explanatory and border text using Adobe Illustrator and deliver a PDF image of a finished-looking, colored geologic map (Figure 1).
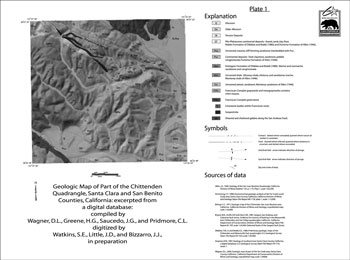
[Click on image to open a larger version in a new window]
|
|
Figure 1. An example of a map quickly produced for a customer (DOGGR). Derived from several 1:24,000-scale maps, this product was clipped from the database and a map explanation and text were added within hours of the request.
|
CONCLUSIONS
The Geologic Map of the Monterey Quadrangle and Adjacent Areas is one of the first geologic maps to show geology across the terrestrial/marine transition seamlessly and therefore is a major step forward in portraying California coastal geology. This map is the result of a cooperative effort by several government agencies, as well as academic and private research institutions. Wagner (1997) described data capture for 1:100,000 scale geologic maps involving digitization at the largest scale possible (preferably 1:24,000) and tiling the maps together. Estimates of the time necessary to digitize individual 7.5' quadrangles proved to be high. However, as expected, edge matching the quadrangles turned out to be a major part of the effort. This method is much more time consuming than digitizing at 1:100,000-scale, but the database is much more versatile. If the digitization and subsequent edits are all done at 1:24,000-scale, then the 1:100,000 scale map is a seamless mosaic of thirty-two 7.5' quadrangles.
REFERENCES
Fitzgibbon, T.T., and Wentworth, C.M., 1991, ALACARTE User Interface-AML code and demonstration maps: U.S. Geological Survey Open-File Report 91-587, 10 p.
Haugerud, Ralph, and Greenberg, H.M., 1998, Recipes for Digital Cartography: Cooking with DEMs, in David R. Soller, editor, Digital Mapping Techniques '98 -- Workshop Proceedings: U.S. Geological Survey Open-File Report 98-487, p. 119-126, https://pubs.usgs.gov/openfile/
of98-487/haug2.html.
Wagner, D.L., 1997, Digital mapping techniques employed by the California Division of Mines and Geology, in David R. Soller, editor, Proceedings of a workshop on digital mapping techniques: Methods for geologic map data capture, management, and publication: U.S. Geological Survey Open-File Report 97-269, p. 35-38, https://pubs.usgs.gov/openfile/of97-269/wagner.html.
RETURN TO Contents
National Cooperative Geologic
Mapping Program | Geologic Division |
Open-File Reports
U.S. Department of the Interior, U.S. Geological Survey
URL: https://pubsdata.usgs.gov/pubs/of/2001/of01-223/wagner.html
Maintained by David R. Soller
Last modified: 18:24:44 Wed 07 Dec 2016
Privacy statement | General disclaimer | Accessibility
