|
|
|
||||
| OFR 01-0429: World Trade Center USGS Thermal |
| About USGS / Science Topics / Maps, Products & Publications / Education / FAQ |
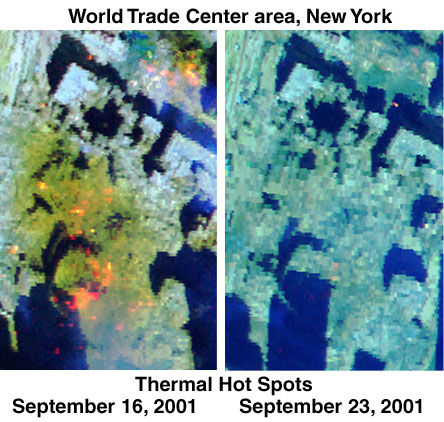
Results of Airborne Visible/Infrared Imaging Spectrometer (AVIRIS) remote sensing data and interpretations show the distribution and intensity of thermal hot spots in the area in and around the World Trade Center on September 16 and 23, 2001. Data collected on the 16th were processed, interpreted and released to emergency response teams on the 18th of September, 2001. The September 23 data were processed, interpreted and the results released on October 12, 2001. The images of the World Trade Center site show significant thermal hot spots on Sept. 16, 2001. By Sept. 23, 2001, most of the hot spots had cooled or the fires had been put out.
The AVIRIS instrument is a National Aeronautics and Space Administration (NASA) remote sensing instrument that measures upwelling spectral radiance in the visible through short-wavelength infrared. The instrument has 224 spectral channels (bands) with wavelengths from 0.37 to 2.5 microns (micrometers).
In response to requests from the EPA through the USGS, NASA flew AVIRIS on a De Havilland Twin Otter over lower Manhattan at mid-day on September 16 and 23, 2001. For these deployments, the Twin Otter was flown at altitudes of 6,500 and 12,500 feet. The spectral data for the maps shown here were measured at 6,500 feet and have a spatial resolution (pixel spacing) of approximately 6 feet (2 meters).
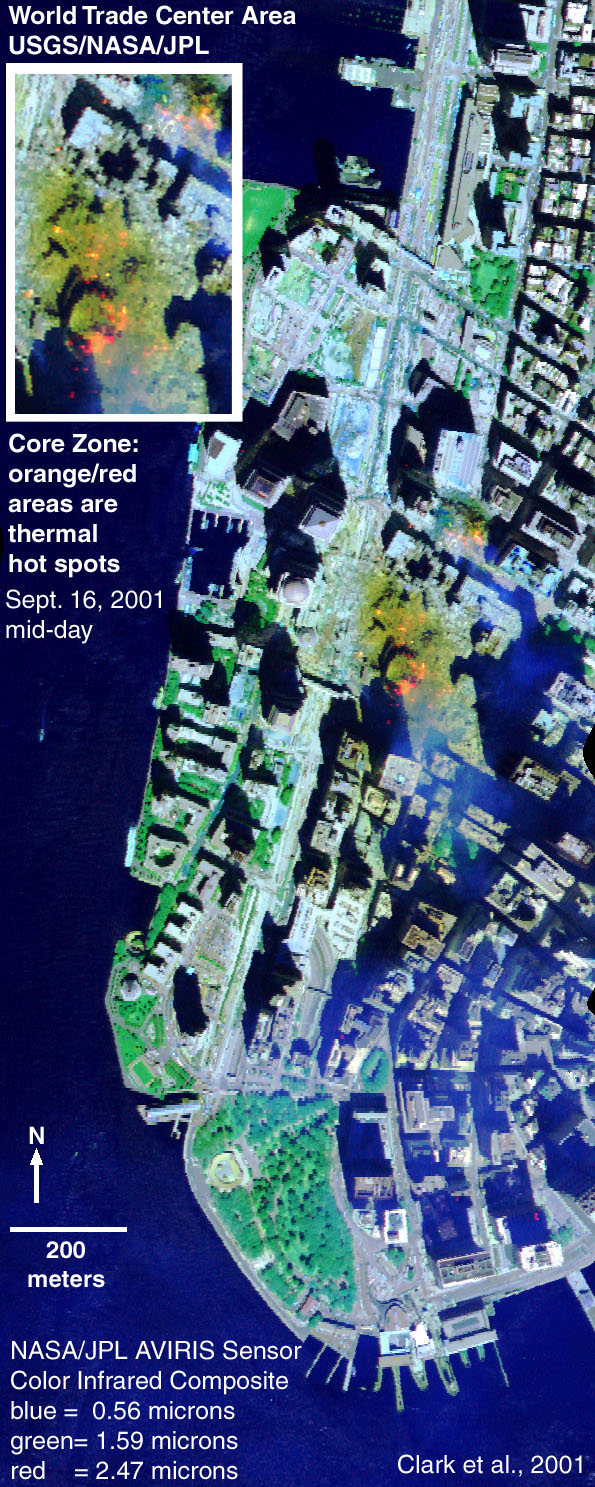
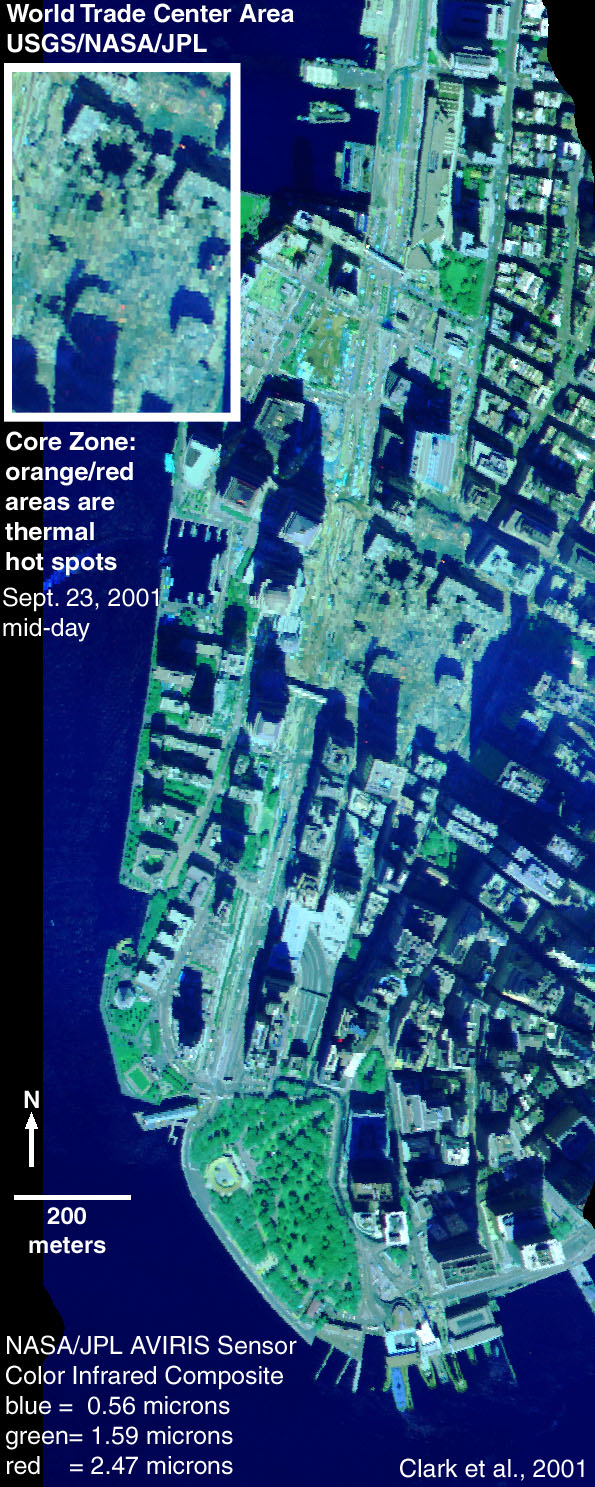
AVIRIS records the near-infrared signature of heat remotely. The accompanying maps are false color images that show the core affected area around the World Trade Center. Initial analysis of these data revealed a number of thermal hot spots on September 16 in the region where the buildings collapsed 5 days earlier. Analysis of the data indicates temperatures greater than 800oF. Over 3 dozen hot spots appear in the core zone. By September 23, only 4, or possibly 5, hot spots are apparent, with temperatures cooler than those on September 16 (Thermal Figure 1).
The images (larger area shown below) also show vegetated areas as green. Water appears blue, and the smoke from the fires appears as a light blue haze. White and lighter blue areas are rooftops, roads, and concrete as well as dust and debris from the collapsed buildings. Dust, probably more than a millimeter thick, appears in shades of brown around the core WTC area on the 16th.
On the September 16th, 2001 image (Thermal Figure 2), large areas around the World Trade Centers show brownish colors, indicating the debris. On September 20, 2001 there was a significant rain storm that washed away some of the dusty debris. Reduction of the distribution of dust/debris is apparent in the September 23 image (Thermal Figure 3), and can be attributed to the cleanup effort along with the rain.
There are other red/orange spots that show in the images in the area south of the World Trade Center zone. These are hot spots from chimneys or heating exhaust vents and are normal and not other uncontrolled fires.
The AVIRIS data were processed at the Jet Propulsion Laboratory (JPL) in Pasadena California where the data are calibrated to radiance and corrected for aircraft yaw, pitch, and roll. Acquisition and calibration of AVIRIS data at JPL are under the direction of Robert O. Green. The data were then transmitted to the U.S. Geological Survey (USGS), Imaging Spectroscopy Group in Denver, Colorado, under the direction of Dr. Roger N. Clark. Atmospheric and ground calibrations were applied to derive apparent surface reflectance and maps were then made of surface materials. The USGS imaging spectroscopy group includes Dr. Gregg Swayze, Eric Livo, and Todd Hoefen.
Thermal Figure 4. Index for the locations of some of the hot spots observed on September 16, 2001.
Remote measurement of the temperature is difficult because the source of the thermal emission can be less than the field of view of the measuring instrument. In that case a thermal sensor has an ambiguous solution: a hotter temperature of a smaller area or lower temperature of a larger area can result in the same total received thermal radiation.
A spectrometer, however, overcomes the ambiguity problem above, because the shape of the thermal spectrum can be used to derive a unique temperature, and the intensity gives the area of the emitting source. If a large enough spectral range is covered, a range of temperatures and the area of each can be derived. In the near infrared spectral range of AVIRIS, reflected solar radiation also contributes to the signal. The solution to the generalized problem involving all these effects is given in Clark (1979).
We derived temperatures using two methods: calibrated radiance, and derived reflectance following Clark's (1979) methods. In derived reflectance, thermal radiation is the Planck response divided by the solar spectrum. This has several effects: 1) the data are corrected for atmospheric absorption and scattering, 2) the reflected solar component can be readily assessed and compensated for, and 3) the ratio of the Black-Body response by the solar spectrum produces a very steep curve that is readily distinguishable from reflected sunlight and reflectance of surface materials.
Simple temperature derivation from derived reflectance is illustrated in Thermal Figure 5a and b. Here the hot spot is assumed to fill the pixel. The thermal response of hot spot A (from Thermal Figure 4) shows the AVIRIS response higher than the 800 kelvin curve. The 800 Kelvin temperature is a lower limit to the temperature. While the upper limit might be the 900 Kelvin curve, we see the slopes do not match. As temperatures increase, the peak in Black Body emission moves to shorter wavelengths and the slope of the curve decreases at positions on the short wavelength side of the peak (the case here).
Hot spot C (Thermal Figure 5b) shows similar effects. For hot spots covering the full area of the pixel, the temperature must be greater than 700 Kelvin. At about 1.3 microns, the model at 800 Kelvin matches the AVIRIS data, but the 800 Kelvin curve has a higher slope. This indicates the hot spot is smaller than the size of the pixel, but hotter than 800 Kelvin.
Solutions that include reflected solar radiation, hot spot temperature and hot spot area are shown in Thermal Figures 6a and b. Hot spot A, which from Thermal Figure 5 has a temperature greater than 800 Kelvin, is found to have a 1000 Kelvin temperature in a spot covering ~15% of a pixel, or 0.56 square meter. Similarly, hot spot C is found to have a 900 kelvin temperature over 20% of a pixel, or 0.8 square meter.
The sensitivity of the solution of area and temperature is illustrated in Thermal Figure 7. An excellent fit is obtained for hot spot C with a 900 Kelvin spot filling 20% of the pixel. At 1000 Kelvin, only 8% is required but the fit is noticeably worse. For temperatures in the 800-1000 Kelvin range, temperature accuracy is estimated to be ± 30 Kelvin and the area ± 5%. For smaller spots, like spot G in Table 1, the temperature accuracy is similar, but the accuracy on such small areas is approximately +5%, -0.5%. For example, decreasing the temperature to 1000 Kelvin (from 1020 Kelvin) on spot G increases the fractional area to about 5%.
Positions, temperatures and equivalent areas for hot spots A-H are given in Table 1 and the geometrically rectified location map is shown in Thermal Figure 8.
Thermal Figure 5a.
Thermal Figure 5b
Thermal Figure 6a
Thermal Figure 6b
Thermal Figure 7.
| Location | Temperature | Area | |||
|---|---|---|---|---|---|
| Hot Spot | N Latitude | W Longitude | (Kelvin) | % FOV | sq meter |
| A | 40o 42' 47.18" | 74o 00' 41.43" | 1000 | 15 | 0.56 |
| B | 40o 42' 47.14" | 74o 00' 43.53" | 830 | 2 | 0.08 |
| C | 40o 42' 42.89" | 74o 00' 48.88" | 900 | 20 | 0.8 |
| D | 40o 42' 41.99" | 74o 00' 46.94" | 790 | 20 | 0.8 |
| E | 40o 42' 40.58" | 74o 00' 50.15" | 710 | 10 | 0.4 |
| F | 40o 42' 38.74" | 74o 00' 46.70" | 700 | 10 | 0.4 |
| G | 40o 42' 39.94" | 74o 00' 45.37" | 1020 | 1 | 0.04 |
| H | 40o 42' 38.60" | 74o 00' 43.51" | 820 | 2 | 0.08 |
Thermal Figure 8. Geometrically rectified image of the WTC core region showing hot spot locations.
Additional temperature analysis: ftp://popo.jpl.nasa.gov/pub/outgoing/WTC_AVIRIS_HOT.htm
NEXT PAGE of Report: Asbestiform Minerals Map
Back to document Table of Contents
For further information, contact:
Dr. Roger N. Clark
rclark@usgs.gov
Link to the AVIRIS JPL data facility)
For information about AVIRIS, contact:
Robert O. Green
AVIRIS Experiment Scientist
rog@spectra.jpl.nasa.gov
| AccessibilityFOIAPrivacyPolicies and Notices | |
| |
|