Open-File Report 02-410
CRUISE REPORT
June 8, through June 28, 2002
Iberia, LA to Iberia, LA
Jonathan D. Beaudoin1, James V. Gardner2, John E. Hughes Clarke1
1University of
New Brunswick, Fredericton, NB
2US
Geological Survey, Menlo Park, CA
Open-File Report OF02-410
Conducted under a Cooperative Agreement between the US Geological Survey and the Ocean Mapping Group, University of New Brunswick, Canada
This report is preliminary and has not been reviewed for conformity with U.S. Geological Survey editorial standards or with the North American Stratigraphic Code. Use of trade, product, or firm names in this report is for descriptive purposes only and does not imply endorsement by the U.S. Government.
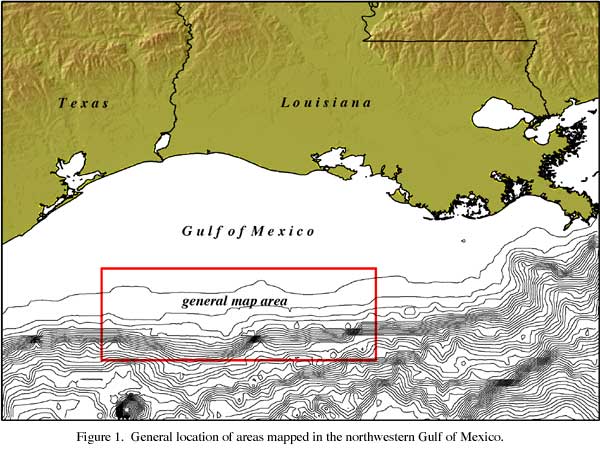
Following the publication of high-resolution multibeam echosounder (MBES) images and data of the Flower Gardens area of the northwest Gulf of Mexico outer continental shelf (Gardner et al., 1998), the Flower Gardens Banks National Marine Sanctuary (FGBNMS) and the Minerals Management Service (MMS) have been interested in additional MBES data in the area. A coalition of FGBNMS, MMS, and the US Geological Survey (USGS) was formed to map additional areas of interest in the northwestern Gulf of Mexico (Fig. 1) in 2002. The areas were chosen by personnel of the FGBNMS and the choice of MBES was made by the USGS. MMS and FGBNMS funded the mapping and the USGS organized the ship and multibeam systems through a Cooperative Agreement between the USGS and the University of New Brunswick.
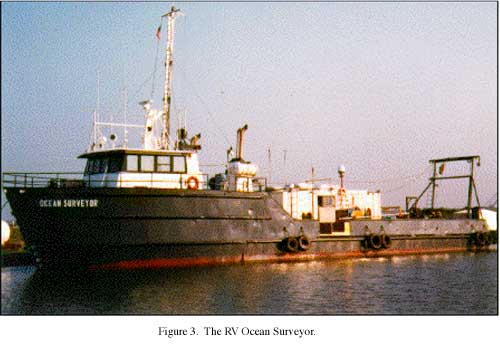
The University of New Brunswick (UNB) contracted the RV Ocean Surveyor and the EM1000 MBES system from C&C Technologies, Inc., Lafayette, LA. C&C personnel oversaw data collection whereas UNB personnel conducted the cruise and processed all the data. USGS personnel were responsible for the overall cruise including the final data processing and digital map products.
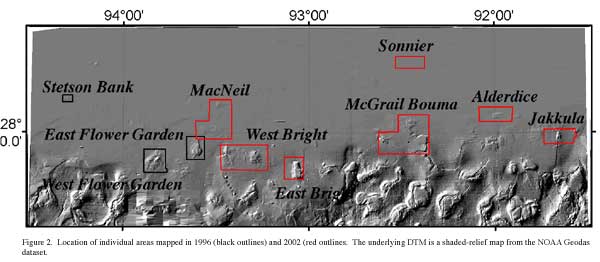
The objective of the cruise was to map 7 regions of interest (Fig. 2) to MMS and the FGBNMS
The Kongsberg Simrad EM1000 High-Resolution MBES
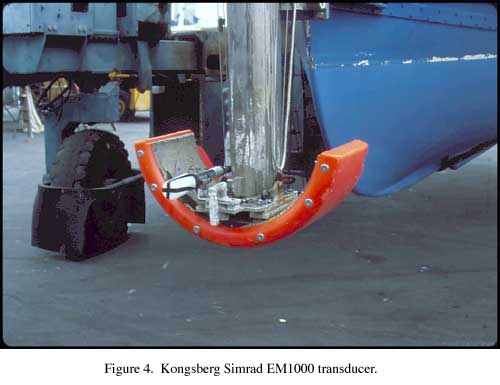
There are several different brands of high-resolution MBES systems that are appropriate for shallow-water surveys. After a review of the currently available systems, a Kongsberg Simrad EM1000 system was chosen for this cruise because; (1) its operating frequency is compatible with the depths of interest, (2) it has the ability to map large areas at high speed without compromising data quality and, most importantly, (3) it has the ability to simultaneously produce high-resolution, calibrated acoustic-backscatter imagery. For this survey, we used an EM1000 system owned and operated by C&C Technologies, Inc., Lafayette, LA, installed aboard the 102-ft RV Ocean Surveyor (Fig. 3). The transducer is mounted on a rigidly attached boom which was lowered through a moon pool in the hull of the ship (Fig. 4).
An overview of high-resolution MBES systems in general can be found in Hughes-Clarke, et al. (1996). The EM1000 multibeam echosounder (MBES) has an operating frequency of 95 kHz, that is effective in water depths that range from 3 to 800 m. The EM1000 offers several modes of operation that depend on survey requirements; each mode has been designed to operate over a subset of the entire range of depths in which the system can operate. Shallow water modes (3-200 m) are characterized by short pulse lengths (0.2 ms) and an angular sector as great as 150° (providing swath widths up to 7.4 times water depth). Intermediate water depths (200 to 600 m) require a longer pulse length (0.7 ms) and a narrower angular sector whereas deeper waters (600 to 800 m) use a pulse length of 2.0 ms and a narrow angular sector that uses only 48 of the 60 possible receive beams. The specific options used for the northwest Gulf of Mexico shelf mapping are discussed in the data processing section below.
Most conventional vertical-incidence echo sounders determine the time of arrival of the returned pulse (and thus the depth) by detecting the position of the sharp leading edge of the returned echo, a technique called amplitude detection. In multibeam sonars, where the angle of incidence increases to either side of the vertical for each consecutive receive beam, a returned echo loses its sharp leading edge and the depth determinations become inaccurate. To address this problem, the Kongsberg Simrad EM1000 MBES system uses an interferometric principle in which each receive aperture is split, through electronic beamforming, into "half beams" and the phase difference for each received signal for each aperture is calculated to provide a measure of the angle of arrival of the echo. The point at which the phase is zero (i.e., where the wave front of the returned echo is normal to the receive-beam bore) is determined for each aperture and provides an accurate measure of the range to the seafloor. Both amplitude and phase detection are recorded for each aperture and the system software picks the "best" detection method for each aperture, based on a number of quality control measurements, and uses this method to calculate depth.
The EM1000 also provides quantitative seafloor acoustic-backscatter data that can be displayed in a sidescan-sonar-like image. The backscatter images can be used to gain insight into the spatial distribution of seafloor properties. A time series of echo amplitudes from each beam is recorded at four times the depth sampling rate (which depends on the water depth and operational mode). The echo amplitudes are sampled at a much faster rate than the projected receive aperture spacings and can be processed from beam-to-beam to produce a backscatter image with the theoretical resolution of the sampling interval (15 cm at 0.2 ms). The amplitude information can be placed in its geometrically correct position relative to the across-track profile because the angular direction of each range sample is known. The EM1000 software corrects the amplitude time series for gain changes, propagation losses, predicted beam patterns, and for the ensonified area (with the simplifying assumptions of a flat seafloor and Lambertian scattering). Subsequent processing (see Processing section below) uses real seafloor slopes and applies empirically derived beam-pattern corrections to produce a quantitative estimate of seafloor backscatter across the swath.
Ancillary Systems
In addition to the multibeam sonar array, a MBES survey requires a careful integration of a number of ancillary systems. These include: (1) differentially corrected Global Positioning (DGPS) to aid an inertial navigation system (INS); (2) an accurate measure of the heave, pitch, roll, and heading of the vessel, all to better than 0.01° and the transformation of these measurements to estimates of the motion of the transducer at the times of transmission and reception (motion sensor); (3) a method to precisely determine the sound-speed structure of the water column, using measurements of temperature and salinity with depth or directly measuring sound speed versus depth.
Attitude Compensation
The northwest Gulf of Mexico shelf mapping was navigated with a TSS Applanix POS/MV model 320 (version 2) INS inertial motion sensor (IMU) as well as dual Trimble model 4000 DGPS with a commercial Satloc satellite differential station. Spatial accuracy (positions) for the mapping is ±0.5 m. In addition, the POS/MV records vehicle motion (pitch, roll, heading, and heave) at 100 Hz with an accuracy of 0.02° for roll, pitch, and heading, and 5% of heave amplitude or 5 cm, which ever is greater.
Sound Speed in WaterColumn
Sound-velocity profiles were calculated several times each day so that ray-tracing techniques could be used to correct refraction of the acoustic wave through the water column. A SeaBird model 19-02 CTD (conductivity and temperature vs depth) was used to measure temperature and salinity versus depth and sound speed vs depth was calculated from these measurements. Two additional sound-velocity sensors are installed on the RV Ocean Surveyor to continuously determine the speed of sound in water at the transducer depth (YSI Model 600 temperature and salinity sensor). All the sound-speed data (SVP) are fed directly into the Simrad EM1000 processor for instantaneous beam forming and ray tracing of the individual receive beams.
Data Sources and Type
Raw EM1000 data telegrams were acquired over a shipboard Ethernet network. The data stream is outlined in Table 1. In addition, a number of ancillary data sources were also acquired by C&C Technologies (Table 2).
The accurate reduction of swath bathymetric data critically depends on a proper knowledge of the geometry and relative positions of the sonar transducer relative to the motion sensor, the ship, and the positioning-system antennae. C&C Technologies, using standard surveying techniques, measured these values (Table 3) before the survey began. All values are measured relative to the transducer.
Table 1. Kongsberg Simrad EM1000 data stream
| Entered static sonar alignment parameters. |
| Applied sound velocity profiles. |
| External navigation data (1-Hz DGPS) |
| Ship-relative bathymetric profile data. |
| Beam-relative backscatter intensity data |
Table 2. Ancillary data sources
| Transducer temperature, conductivity and (derived) sound speed data. |
| POS/MV 1-Hz position and attitude data . |
| Independent serial record of DGPS data stream (GPGGA format). |
| Original SeaBird SVP data |
EM1000 Operational Modes
There are several operational modes available for the EM1000. The differences in the modes are a function of pulse length, beam spacing, and angular sector. The pulse length controls the amount of energy transmitted into the water column. The beam spacing governs the density and spacing of the soundings on the seafloor whereas the angular sector dictates how much of the seafloor is ensonified in one ping.
Although there are
numerous operational modes available, the northwest Gulf of Mexico
mapping worked primarily in two variations of shallow mode: EA-150
and ED-128. The former is characterized by equiangular beam spacing
and a 150° angular sector, whereas the latter uses equidistant
beam spacing, with a resulting angular sector of 128°.
Equiangular spacing has the distinct advantage that there is minimal
electronic beam steering for the receive apertures, thereby reducing
errors because of imperfect knowledge of the water column since all
beams (except outer beams) are physically steered. The disadvantage
of equiangular beam spacing is that the spacing of the beam
footprints on the seafloor grows non-linearly with incidence angle.
With equidistant beam spacing, the receive apertures are steered in
such a manner to achieve a regular footprint spacing on the seafloor.
However, the disadvantage is that bathymetric solutions are now
contaminated to a greater extent with the effects of refraction in a
poorly known velocity structure of the water column. There is an
additional drawback to equidistant beam spacing in that the beams in
the 140° and 150° modes are spaced wider than their beam
widths and results in incomplete coverage that produces a striping
close to nadir. This problem disappears as the swath width closes to
~120°, thus a swath width of 128° was used when the sonar was
operated in equidistant mode.
Tides
All soundings are reduced to mean lower low water using predicted tides (World Tides 2002) for the Galveston Pleasure Pier. The range in the tidal data set provided was approximately one meter.
Bathymetry
All bathymetric data were adjusted through Kongsberg Simrad software for (1) transducer draft, (2) static roll, pitch and gyro misalignments, (3) roll at reception, (4) refracted ray path, and (5) beam steering at transducer interface. Post-logging transformations included (1) tide corrections, and (2) any unaccounted-for static attitude misalignments. The POS/MV reduced all positions to the transducer, thus there was no requirement to correct for a lever arm between the GPS antennae and sonar transducer in post-processing.
Backscatter
The Kongsberg Simrad
EM1000 provides a backscatter-intensity time series for the bottom
ensonification period for each of the individual receive beams. The
corrections applied by the shipboard recording system are listed in
Table 4. The transformations include, (1) conversion of each beam
backscatter time series to a horizontal range equivalent, (2) a
compilation of all individual beam traces together to produce one
full slant-range-corrected trace, and (3) removal of residual
beam-pattern effects. Although the system software corrects for
average beam pattern, there are ±2 dB ripples in the average
beam pattern that vary from transducer to transducer.
| Forward (X) | STRB (Y) | Downward (Z) | |
|---|---|---|---|
| Echosounder to IMU mounting angles | 0.487 | -2.900 | 0.0 |
| Ship to IMU mounting angles | 0.0 | 0.0 | 0.0 |
| IMU to Echosounder lever arms (m) | -0.310 | -0.080 | 2.992 |
| IMU to GPS lever arm (m) | -8.360 | -1.846 | -5.005 |
| GAMS parameter setup | 2-antenna separation: 2.4358 m |
Heading calibration threshold: 0.500 | Heading correction: 0.00 |
| Simrad installation parameters | Motion sensor delay: 0.0 ms |
Pitch installation angle: 0.0 |
Waterline 3.80 m |
The data processing approach to backscatter was to stack several thousand pings to view the angular variation of received backscatter intensity as a function of beam angle. Inherent in this function is both the transmit and receive sensitivities, as well as the mean angular response of the seafloor. This function is then inverted to minimize the beam pattern and angular variations.
Kongsberg Simrad uses a variable gain within 15° of vertical to reduce logged dynamic range at nadir and near-nadir. The sidescan data at this stage have had a Lambertian response backed out and the beam pattern has been empirically corrected with respect to the vertical and all receive beams have been roll stabilized. Consequently, corrections have been made for variations in the beam-forming amplifiers but not variations in the stave sensitivities of the physical array. Additional transformations can be applied to produce calibrated backscatter measurements. These include (1) removal of Lambertian model, (2) true seafloor slope correction, (3) refracted ray-path correction, (4) residual beam-pattern correction, and (5) aspherical-spreading corrections.
Table 4.
Corrections applied to each beam for backscatter
| Source power adjustments. |
| Spherical spreading compensation. |
| TVG adjustments. |
| Designed beam-pattern compensation. |
| Calculation of insonified area (assuming a flat seafloor at the nadir depth). |
| Application of a Lambertian model using flat seafloor equivalent grazing angles) to reduce the dynamic range of the data (stored at 8 bit (0= -128dB, 255 = 0 dB.). |
Despite the careful measurements of transducer alignments and offsets, the true geometry of the installed system can only be determined through the determination of the self-consistency of seafloor measurements. To facilitate such a determination, a series of "patch tests" were conducted the first day near the first map area. The ship was run back and forth across a seafloor feature to determine if there were residual roll, pitch, heading, or timing offsets in the MBES data that required correction factors. A full patch test procedure was started prior to data collection on May 16 to calibrate any time delay, and gyro misalignment. The static adjustments were estimated from the patch test are listed in Table 5.
Table 5. Adjustments to shipboard alignments
| Time delay 0.0 s |
| Gyro misalignment 0.0° |
| Roll misalignment 0.035° |
| Pitch misalignment 0.0° |
| The roll offset was entered into the POS/MV software |
The 1-Hz DGPS and 100-Hz
INS navigation data were logged with the Kongsberg Simrad EM1000
software. The Bottom Detection Unit (BDU) time stamps the depth and
backscatter telegrams and was slaved to a shipboard SUN Ultrasparc 2
workstation that was synchronized to the GPS 1-PPS. The navigation
telegrams were externally stamped by the Trimble 4000 GPS receiver.
The receiver antenna positions were shifted to the transducer
position according to the X, Y and Z offsets using the POS/MV output
(Table 3). Every 1-Hz navigation fix was checked for gross time
and/or distance jumps by graphical examination during data
processing. Outliers were interactively interrogated for time,
flagged and rejected (or re-accepted). All navigation jumps greater
than 20 s were automatically flagged and not used. On the whole, the
navigation was reliable throughout the cruise with only occasional
problems (e.g. loss of differential correction).
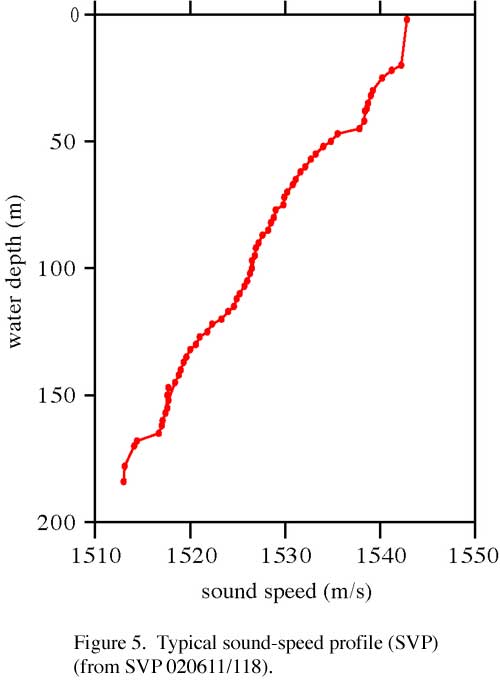
The single biggest limitation on the quality of sounding data is water-column refraction. Refraction-related anomalies grow non-linearly with beam angle and the resulting artifacts can create short-wavelength topographic features that may be misinterpreted as seabed relief. Repeated CTD casts allowed us to correct for refraction effects. A representative water-velocity profile is shown in Figure 5. In additional, minor empirical refraction corrections were applied during processing.
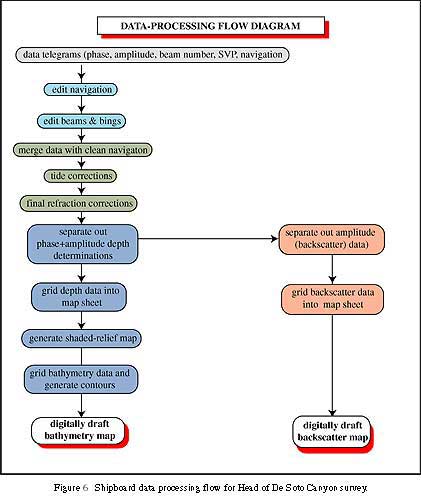
Shipboard data processing (Fig. 6) consisted of (1) the editing the 1-Hz navigation fixes to flag bad fixes; (2) examining each beam of each ping to flag outlier beams, bad data, etc.; (3) merging the depth and backscatter data with the cleaned navigation; 4) correcting all depth values to a mean lower low water tide datum; (5) performing additional refraction corrections, if necessary, for correct beam ray tracing; (6) separating out the amplitude measurements for conversion to backscatter; (7) gridding depth and backscatter into a geographic projection at the highest resolution possible with water depth (Table 6).
| Map Sheet | resolution in m/pixel | size in pixels |
|---|---|---|
| Alderdice | 4 | 4594 x 2193 |
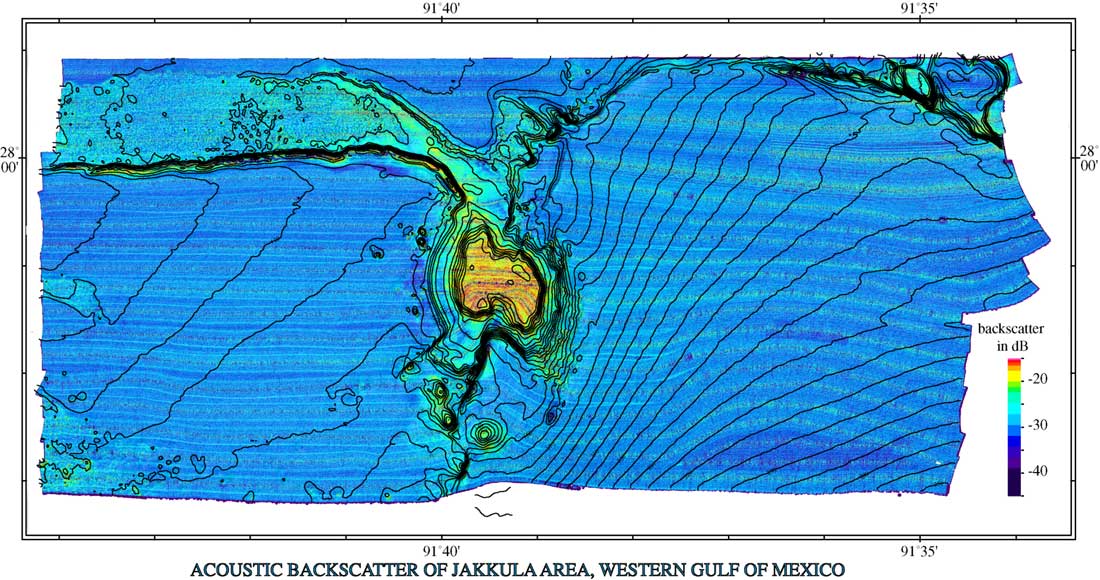
| Jakkula | 4 | 4475 x 2200 |
| East Bright | 4 | 2653 x 3197 |
| West Bright | 4 | 6324 x 3627 |
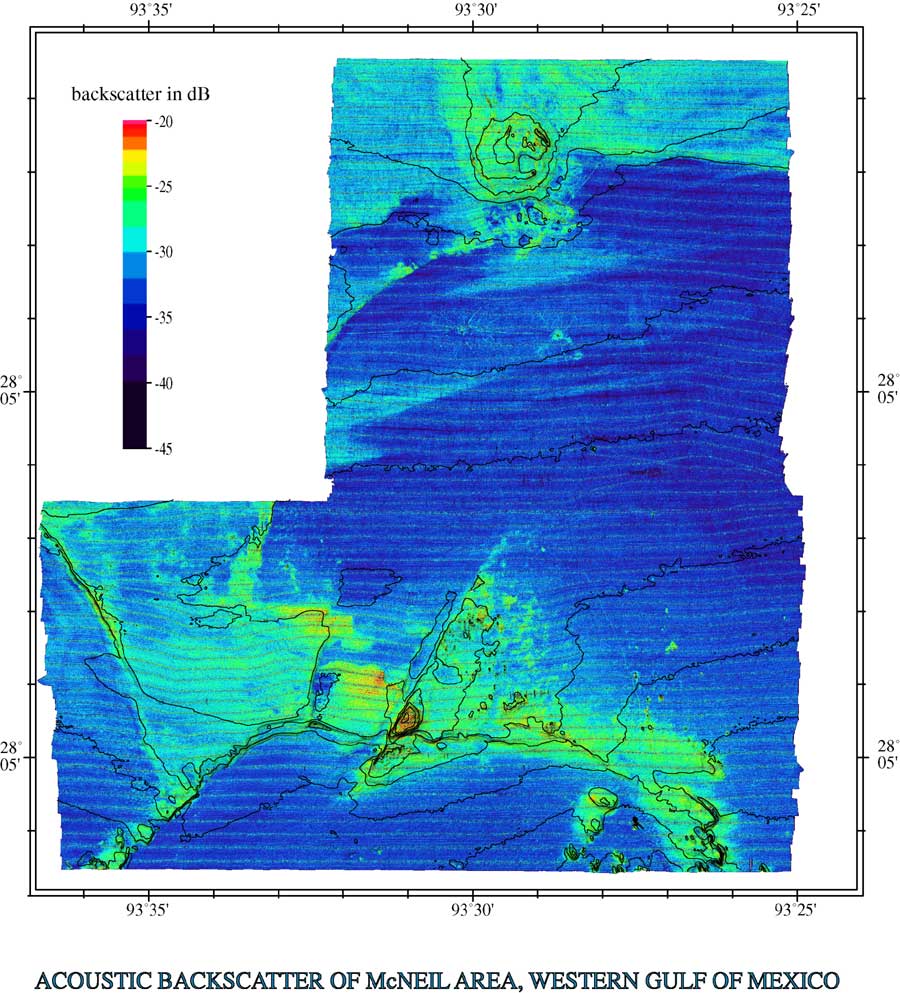
| Macneil | 4 | 5184 x 5404 |
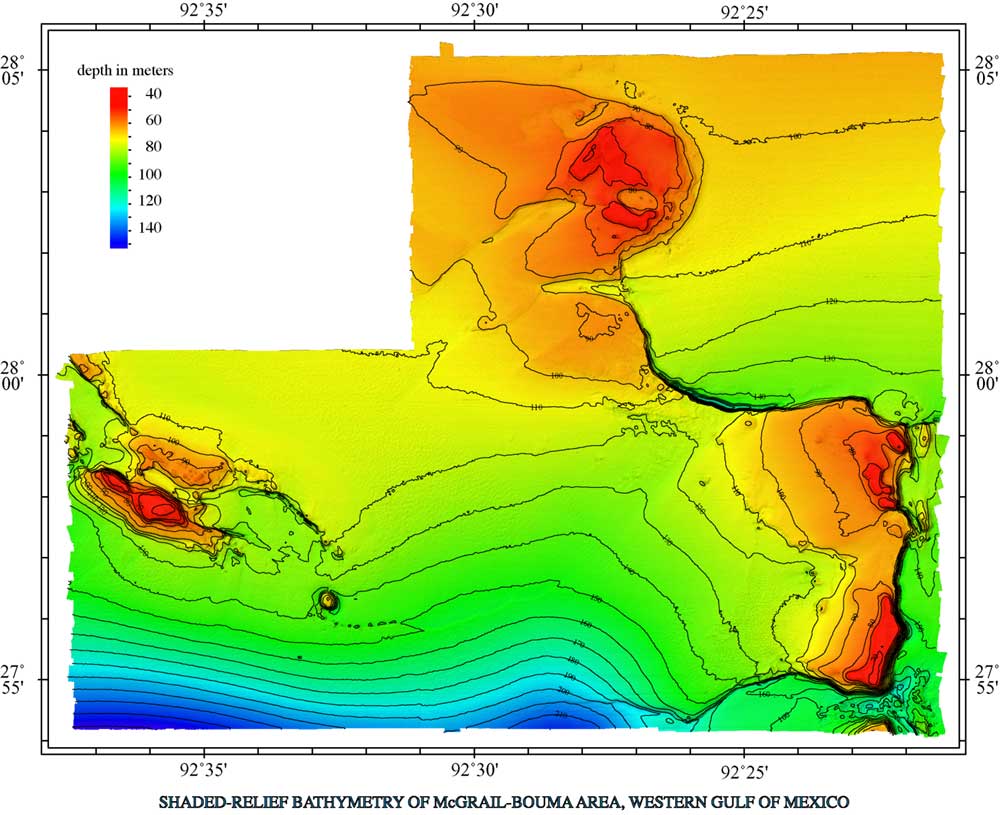
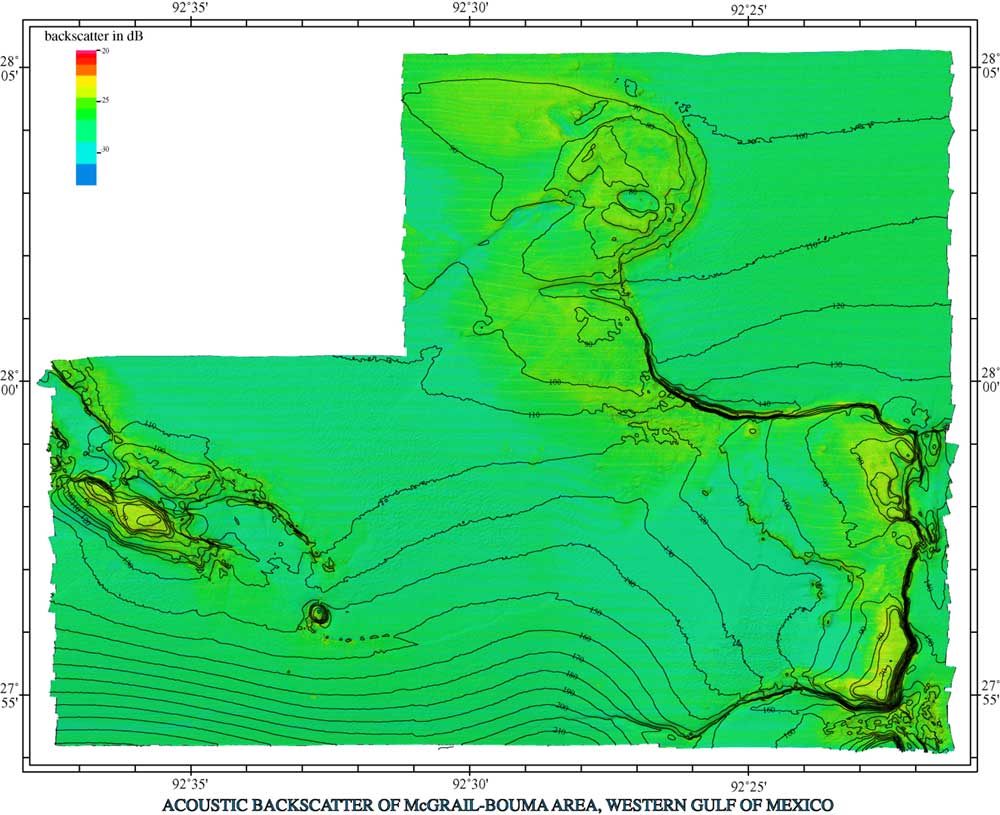
| McGrail Bouma | 4 | 6908 x 5431 |
| Sonnier | 4 | 3891 x 2314 |
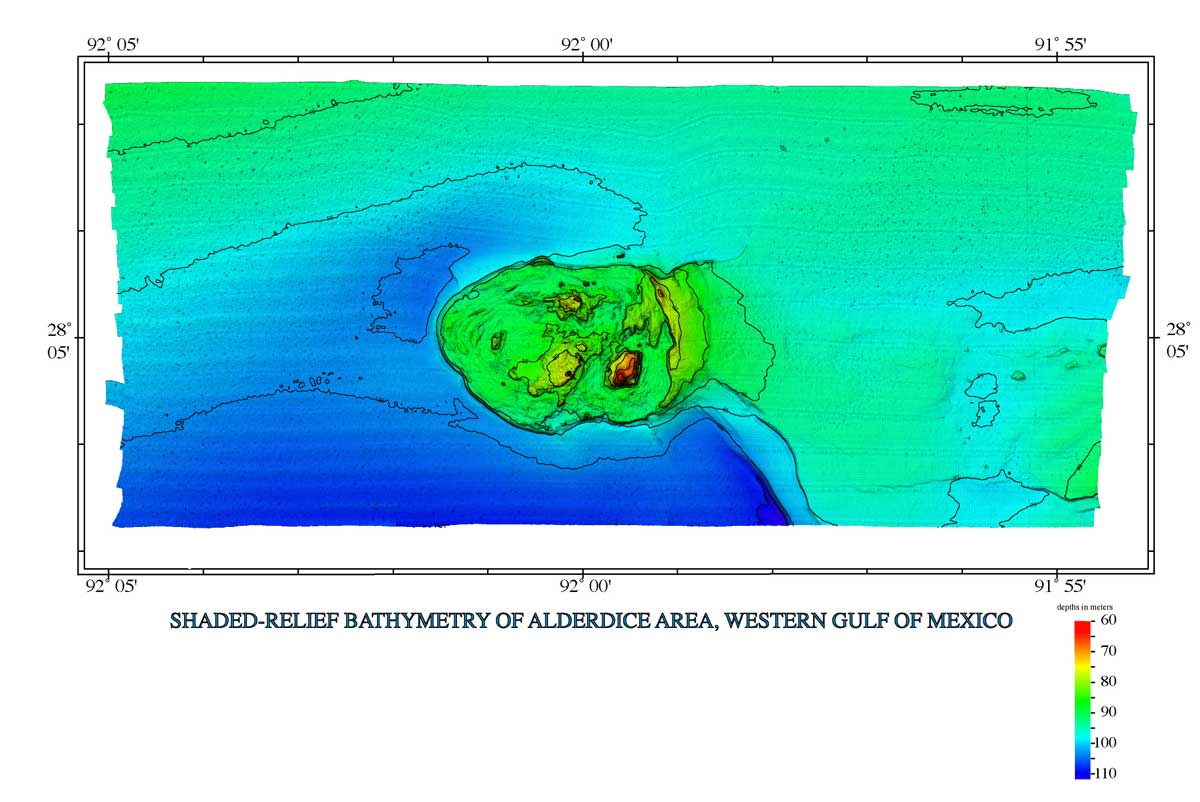
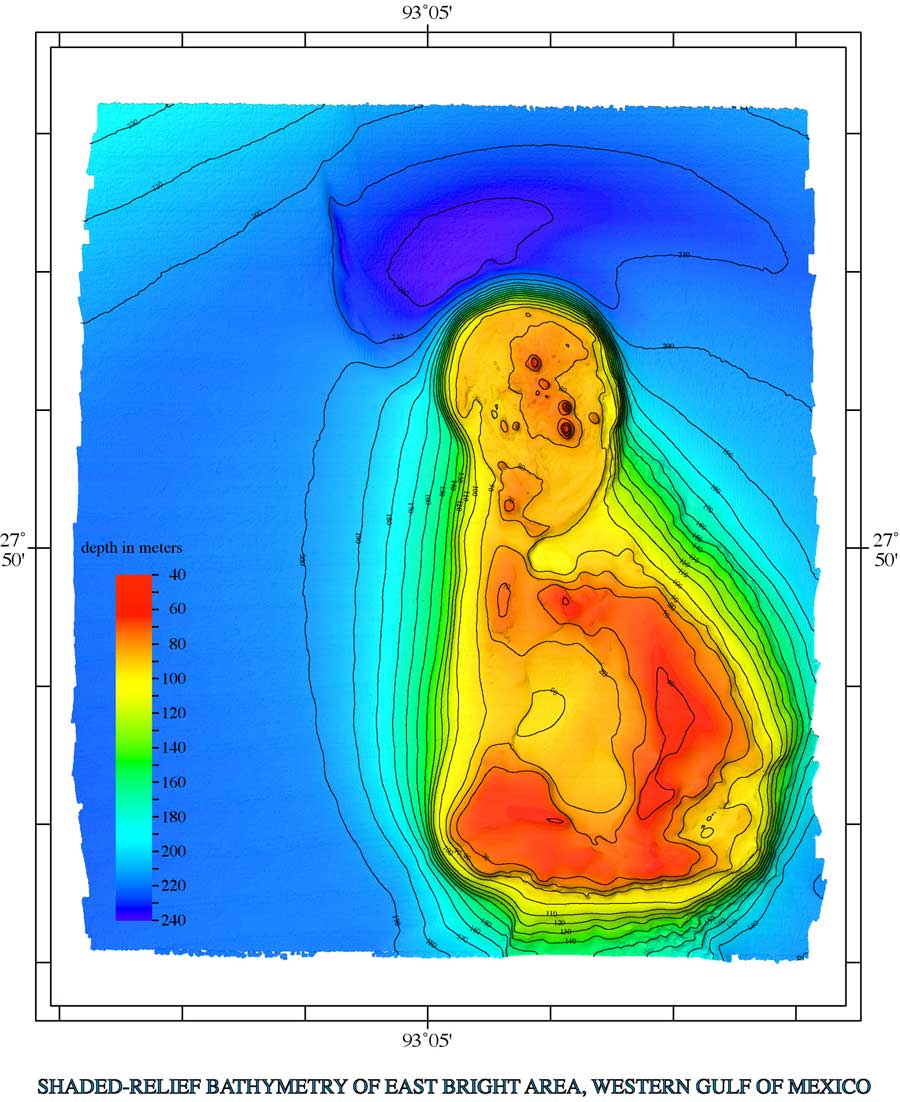
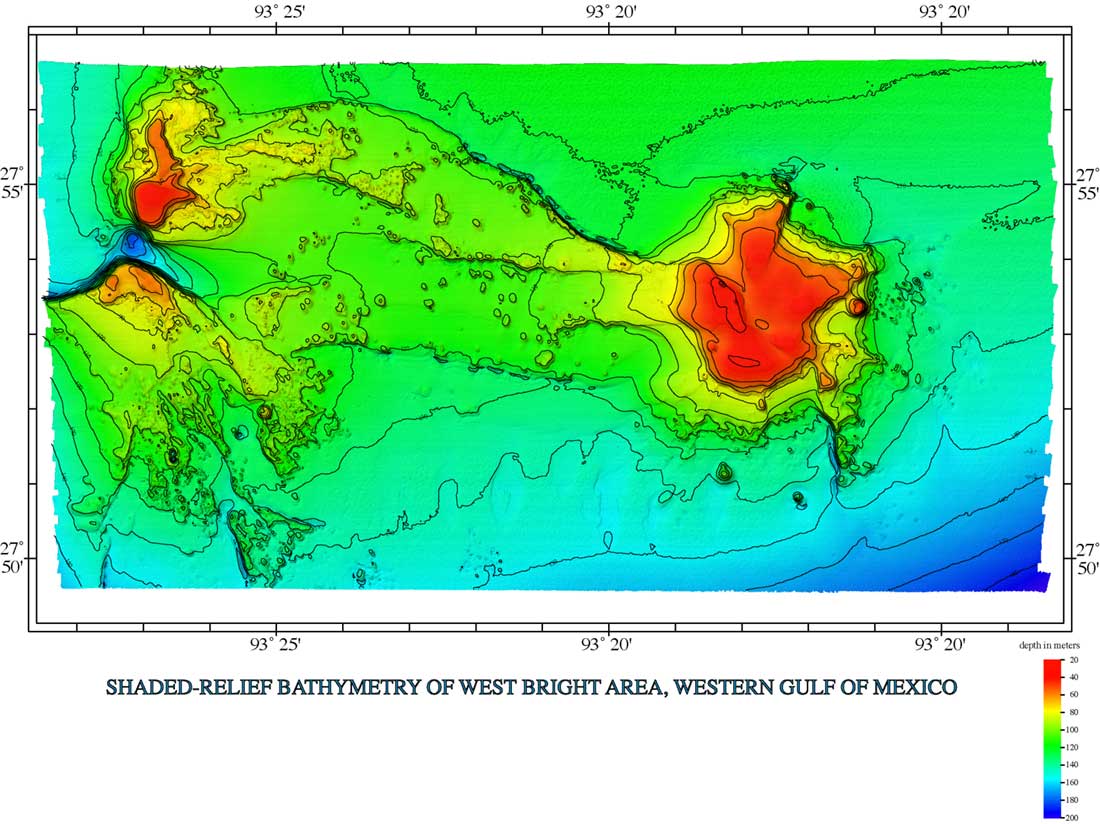
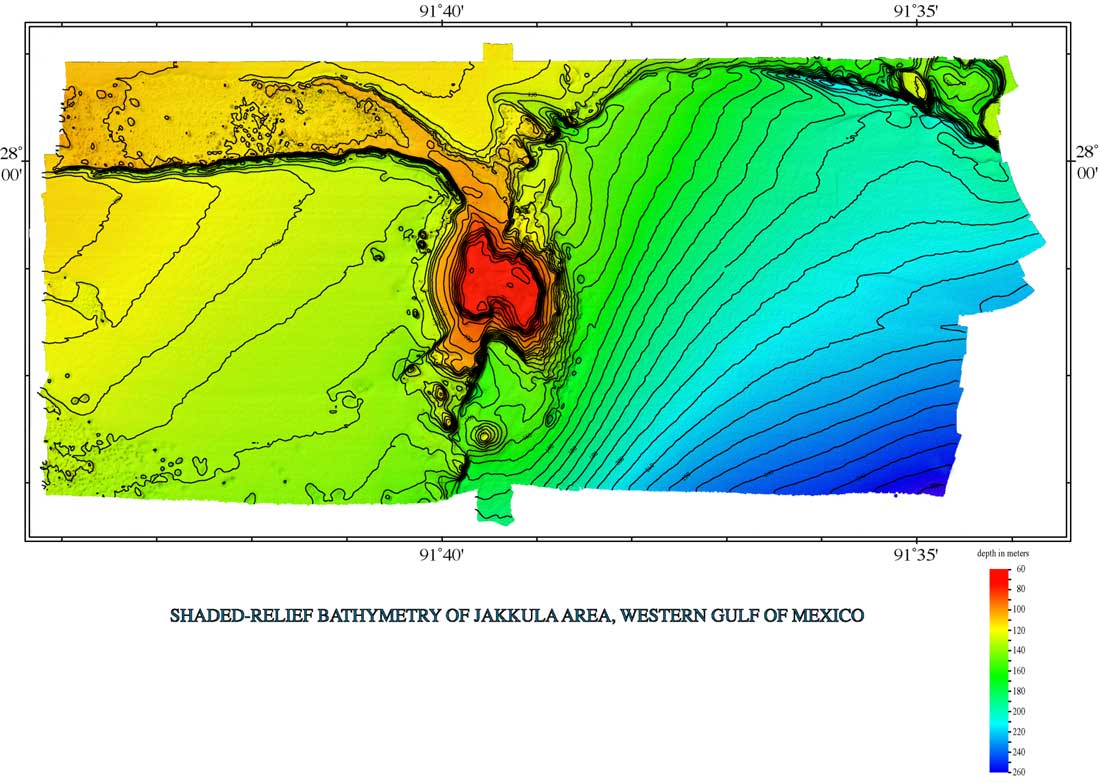
Overview maps of backscatter and shaded relief (Appendix I) were generated for all areas of interest. Shaded-relief and acoustic-backscatter maps were generated at 4 m/pixel resolution.
A shaded-relief map is a pseudo-sun-illumination of a topographic surface using the Lambertian scattering law (equation 1), where SI is the pseudo-sun intensity, K is a constant that allows for even background, and F is the angle between the pseudo sun and the bathymetric surface.
SI = K * cos2 F (Eq. 1)
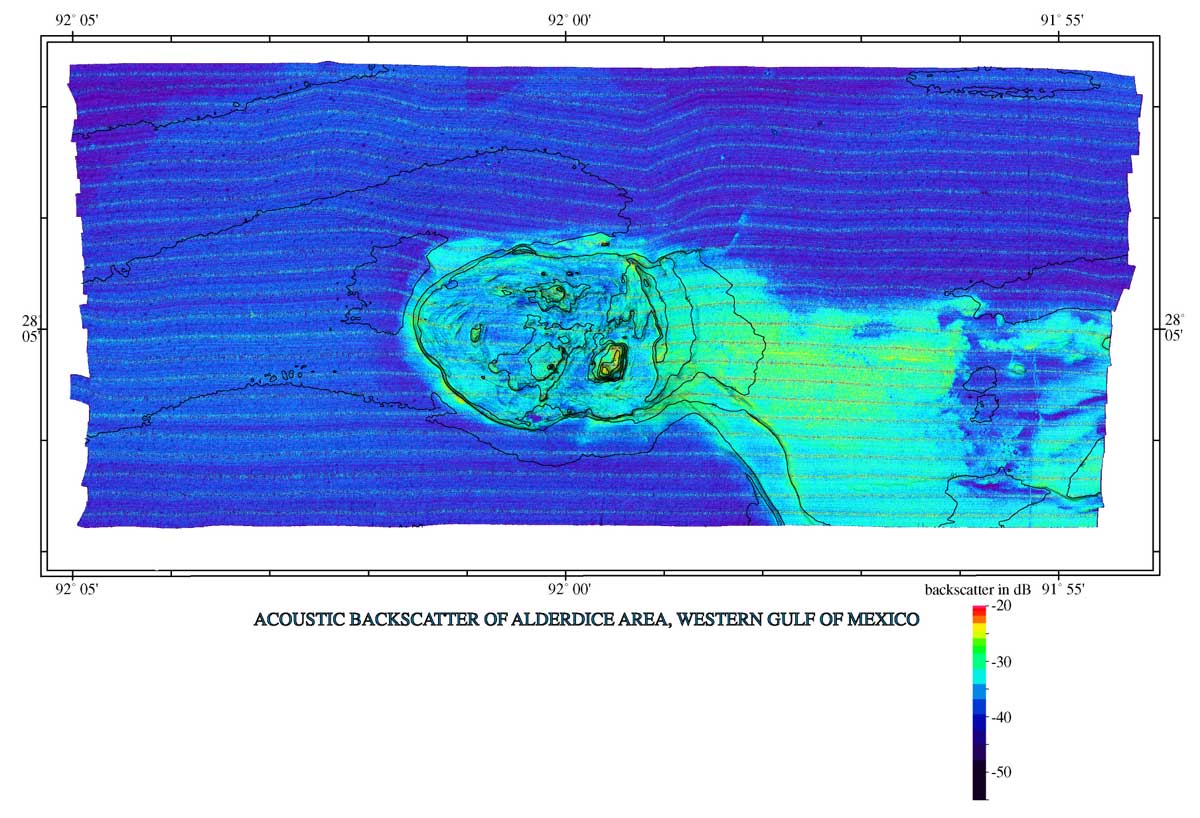
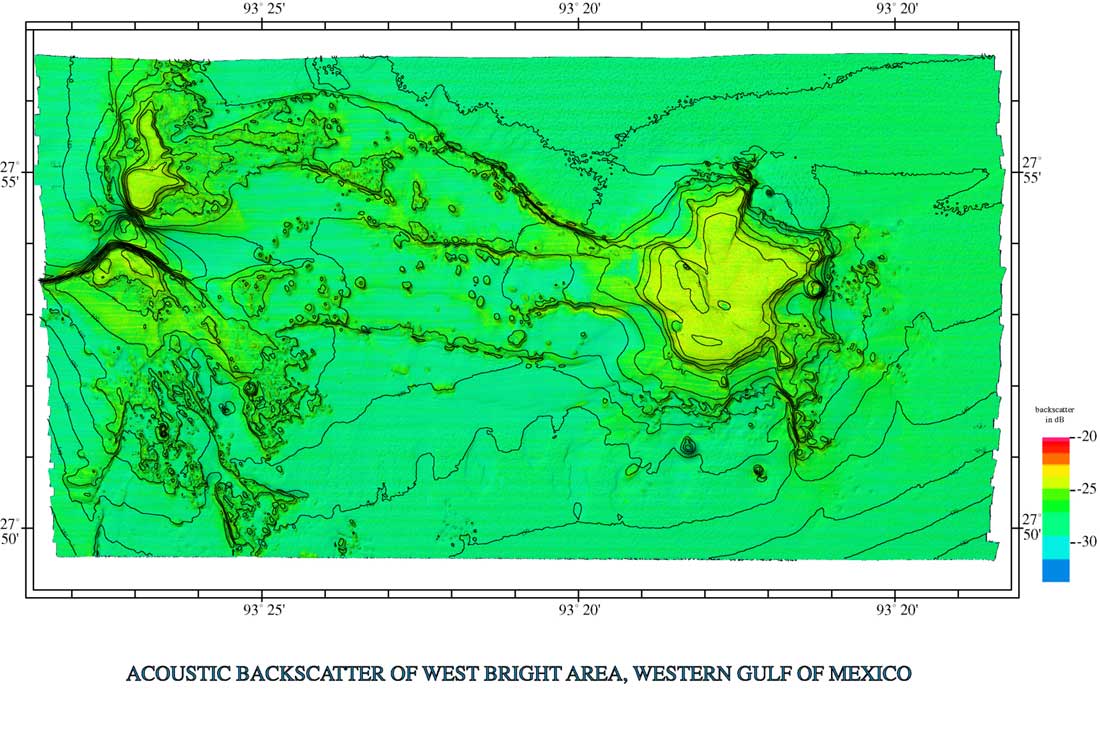
The backscatter map is a
representation of the amount of acoustic energy, at ~95 kHz, that is
scattered back to the receiver from the seafloor. The Kongsberg
Simrad EM1000 system has been calibrated at the factory and all
gains, power levels, etc. that are applied during signal generation
and detection are recorded for each beam and are used to adjust the
amplitude value prior to recording. Consequently, the backscatter is
calibrated to an absolute reflectance of the seabed. However, the
amount of energy, measured in decibels (dB), is some complex function
of constructional and destructional interference caused by the
interaction of an acoustic wave with a volume of sediment or, in the
case of hard rock, the rock material. The backscatter from sediment
represents volume reverberation to at least 5 cm caused by seabed and
subsurface interface roughness above the Rayleigh criteria (a
function of acoustic wave length), the composition of the sediment,
and its bulk properties (water content, bulk density, etc.).
Although, it is not yet possible to determine a unique geological
facies from the backscatter value, reasonable predictions can be made
from the backscatter based on the known local geology.
One of the great advantages of this mapping survey is that every sounding of the bathymetry is accurately georeferenced and coregistered with an acoustic backscatter value. Each pixel on the map has a latitude, longitude, depth, and backscatter value assigned to it. Consequently, there is no ambiguity in correlating the backscatter to the bathymetry, as is often the case when correlating backscatter sonar with bathymetry.
June 8, 2002 (JD 159)
We set out
from Port of Iberia, LA in the early afternoon with an expected
transit time of 6 hr to reach open water. After passing through the
locks, we steamed for approximately 12 hr to the first survey site
(Jakkula), arriving Sunday morning.
June 9, 2002 (JD 160)
A patch test
consisting of several lines was run in order to find any systematic
biases in the alignment angles between the sonar head and POS/MV.
Preliminary lines showed a variation of 0.035o from the
previously measured value of 0.452o. The correction
(0.035o) was applied but with the improper sign and thus
the next lines showed twice the variation. This was corrected with
the lines being run a third and final time to ensure the correct
entry of the alignment parameters. The pitch offset was found to be
consistent with the offset determined in the patch test prior to the
cruise (May 16). Data collection began shortly after 1200 hr
(local).
A GMT rollover issue arose
at midnight GMT (1900 local) in that the date did not rollover in the
Simrad navigation time stamps until 1 to 2 s after midnight. A bug in
the Simard–to-OMG conversion software (RT) compounded this
problem by subtracting 10 days from the Julian day after the midnight
rollover. This was corrected by modifying the OMG software to detect
and correct the midnight rollover in addition to adding a fixed
number of days to the date stored in the OMG navigation and
bathymetry telegrams (done through two separate programs). These two
programs were applied during the conversion stage from this point on
for the entire survey.
June 10, 2002
(JD161)
Surveying continued
in the Jakkula area, finishing up at 2300 hr (local). A residual beam
pattern artifact was noticed in the backscatter mosaics after removal
of the mean angular response. Upon investigation of the angular
response curves of the lines in question, it was found that nulls
appeared at certain angles away from nadir. The artifacts persisted
throughout the entire survey, although a software solution was later
written to correct the problem. Proceeded to next survey area
(Alderdice), with a transit time of 2 hr.
June 11, 2002
(JD162)
Surveying began at
0100 hr. The surface-sound-velocity sensor began to output erroneous
data, causing significant refraction artifacts in the outer beams
partially through line 31 (swath no. 2714). C&C changed the
sensor and the refraction errors fell within tolerable limits. A
POS/MV error caused a small data holiday over the feature of interest
on line 40; this gap was later filled in during cross-line
collection.
June 12, 2002
(JD163)
Another routine day
of surveying, this time finishing up the area at approximately 1800
hr. Proceeded to next survey area (Sonnier). Began data collection in
Sonnier
June 13, 2002
(JD164)
Artifacts in
bathymetry appeared in outer starboard beams as a rising or falling
by several decimetres. These were dubbed "roach legs" and
usually appeared in heavier sea states. The artifacts manifested
themselves in the backscatter as drops in intensity (black
across-track bands). The bottom tracking in the outer beams was
fooled by multiples while surveying over the
high-backscatter/high-relief areas. Once cleaned, these beams
continued to influence the data quality during the backscatter
conversion from slant range to horizontal range. Long, black across
track bands appeared in the holes left by the flagged beams and
required the modification of OMG software (makess) to discard shorter
"suspicious" footprint lengths during the backscatter
generation process. Higher rate of beam dropouts also made for many
data holidays in the backscatter maps. Typically, OMG software can
handle a few dropouts by linearly interpolating across gaps (glfill).
The observed gaps were falling outside of the tolerance of glfill,
thus the software was modified to compensate for the larger gaps both
inthe across-track and along-track directions.
June 14, 2002
(JD165)
Finished data
collection in Sonnier at 1030 hr and proceeded to McGrail Bouma,
arriving at 1428 hr. A phone communication with Jim Gardner suggested
the removal of the northwest corner of the survey area in hopes of
speeding up operations.
June 15, 2002
(JD166)
D. Cartwright noticed
a systematic roll bias of 0.15o in the Sonnier data set
(due to the extremely flat terrain) and retroactively
"unrolled" the data prior to the current line. It was
decided to not change the POS/MV settings such that the entire survey
is affected by the same roll bias. Data collected from this point on
was unrolled during the conversion to OMG format (in the unravel
script).
June 16, 2002
(JD167)
POS/MV dropouts
corrupted line 117, so lines 118 and 119 were run to calibrate the
unit. Normal operations resumed for following line 119. A change of
schedules with C&C made immediate return to port necessary and
data collection stopped one quarter of the way through line 124 at
0800 hr. Steamed for Cameran, LA and arrived late in the evening.
Refuelled immediately with a partial crew change and tied up for the
night.
June 17, 2002
(JD168)
Left Cameron, LA late
in the morning and returned to McGrail Bouma area to continue mapping
surveying. Arrived at at McGrail Bouma at midnight.
June 18, 2002
(JD169)
Resumed data
collection at McGrail Bouma at 0020 hr. It was quickly noticed that
there was an inconsistency between the current survey line and the
survey lines collected before our return to port. C&C found that
the problem consisted of an incorrect transducer draft setting in the
Simrad: a draft of 2.75 m was entered since the beginning of the
survey whereas it should have been 3.80 m. The draft error was
corrected and retroactively applied to previous survey lines as a
constant offset during the process of merging tides.
June 19, 2002
(JD170)
Email communication
from Jim Gardner gave updated coordinates for Bright area,
effectively cutting the large area into two smaller polygons (while
trimming away non-essential portions of the survey area).
Line 160 began in the
smaller northeastern section, effectively cutting line length in
half. At midnight, the RT program lost another 10 days (see note on
June 9, (midnight rollover and RT bug). The unravel script was
modified to add 20 days to all navigation and bathymetry data from
this point on.
June 20, 2002
(JD171)
Finished collection
over McGrail Bouma area at 1320 hr and proceeded to Bright area,
arriving at 1600 hr. Began in the eastern region of Bright area..
June 21, 2002
(JD172)
Email from Jim
Gardner updated coordinates for MacNeil area allowing for a
significant time savings.
Noticed abnormally
large heave values stored in merged data. Upon further examination,
it was found that heave is stored in decimetres when RT converts raw
Simrad to OMG format (thus 0.60 m of heave is stored as 60). This is
not necessarily an issue since heave is accounted for in the Simrad
software, however, it may complicate removal of any long-term heave
artifacts from the data set. NOTE: this is consistent throughout the
entire data set, even though it was not noticed until this point.
June 22, 2002
(JD173)
Routine day of mapping.
June 23, 2002 (JD174)
Heavy seas
make for noisy bathymetry and backscatter. Vessel speed was reduced
during line 283 but it only provided minor improvement in data
quality. No data holidays resulted but the data became increasingly
tedious to edit. Noisy data are characterized by low beam-averaged
backscatter.
June 24, 2002 (JD175)
Completed data
collection over Bright Complex at 1630 hr and proceeded to MacNeil
area arriving at 1800 hr.
June 25, 2002
(JD176)
POS/MV and/or Simrad
problems caused delay and intermittent operations through lines 348
through 362 while problem was being corrected. Corrupt lines were
stored in a sub-directory such that they would not be included in any
gridding process (lines 352 to 354).
June 26, 2002
(JD177)
Developed software
tool to clean bathymetry data based on beam-averaged intensities (see
June 23, re: noisy data). This tool creates a temporary OMG file that
stores the intensities as depths, thus allowing the operator to clean
low intensities very easily since they fall outside the typical
intensity envelope. This was added as a second cleaning step in
addition to normal swath editing (this cleaning step was
retroactively applied to areas in which it was required).
June 27, 2002
(JD178)
Completed MacNeil
area at 1615 hr and immediately headed for Port of Iberia.
June 28, 2002
(JD179)
We arrived at the
dock in Port of Iberia, LA at 1100 L, thus completing the cruise.
| USGS Team | Leg 1 | Leg 2 |
|---|---|---|
| Jonathan Beaudoin | X | X |
| Douglas Cartwright | X | X |
| Anya Duxfield | X | X |
| Jennifer Coppola | X | X |
| C&C Team | Leg 1 | Leg 2 |
|---|---|---|
| Curtis Callaway, Party Chief | X | X |
| Lon Theriot | X | X |
| Ryan Poff | X | |
| Chen-wei Wu | X | X |
| Balbir Bains | X | X |
| Johnny Alcina, Captain | X | |
| Ricky Businelle, Captain | X | X |
| Leo Lopez, Captain | X |
Gardner, J.V., Mayer, L.A., Hughes Clarke, J.E., and Kleinier, A., 1998, High-resolution multibeam bathymetry of East and West Flower Gardens and Stetson Banks, Gulf of Mexico. Gulf of Mexico Science, v. 16, p. 131-143.
Hughes-Clarke, J.E., Mayer, L.A., and Wells, D.E., 1996, Shallow-water imaging multibeam sonars: A new tool for investigating seafloor processes in the coastal zone and on the continental shelf. Marine Geophysical Researches, 18: 607-629.
Appendix I: DTMs and acoustic backscatter mosaics of the 7 areas mapped.
Alderdice Shaded-Relief Bathymetry
Alderdice Acoustic Backscatter
Sonnier Shaded-Relief Bathymetry
East Bright Shaded Relief Bathymetry
East Bright Acoustic Backscatter
West Bright Shaded Relief Bathymetry
West Bright Acoustic Backscatter
Jakkula Shaded-Relief Bathymetry
MacNeil Shaded-Relief Bathymetry
McGrail-Bouma Shaded Relief Bathymetry
McGrail-Bouma Acoustic Backscatter

![]() U.S. Department of the Interior |
U.S. Geological Survey
U.S. Department of the Interior |
U.S. Geological Survey
URL: http://pubsdata.usgs.gov/pubs/of/2002/0410/intro.html
Page Contact Information: GS Pubs Web Contact
Page Last Modified: Wednesday, 07-Dec-2016 19:27:46 EST
