High resolution aeromagnetic
survey data flown at 250 m above the terrain and 250 m line spacing over the
Santa Cruz Valley and the surrounding Tumacacori, Patagonia, and Santa Rita
Mountains has been interpreted by correlation of the magnetic anomaly field
and various derivative maps with geologic maps. Measurements of in-situ magnetic
properties of several of the map units determined whether or not mapped lithologies
were responsible for observed anomalies. Correlation of the magnetic anomaly
field with mapped geology shows that numerous map units of volcanic and intrusive
rocks from Jurassic Middle Tertiary in age are reversely polarized, some of
which have not been previously reported. Trends derived from the magnetic anomaly
data correlate closely with structures from major tectonic events in the geologic
history of the area including Triassic-Jurassic crustal accretion and magmatism,
Laramide magmatism and tectonism, northeast-southwest Mid-Tertiary extension,
and east-west Basin and Range extension. Application of two textural measures
to the magnetic anomaly data, number of peaks and troughs per km (a measure
of roughness) and Euclidean length per km (a measure of amplitude), delineated
areas of consistent magnetic anomaly texture. These measures were successful
at the delineation of areas of consistent magnetic lithology both on the surface
and in the subsurface beneath basin fill. Several areas of basement prospective
for mineral resources beneath basin fill were identified.
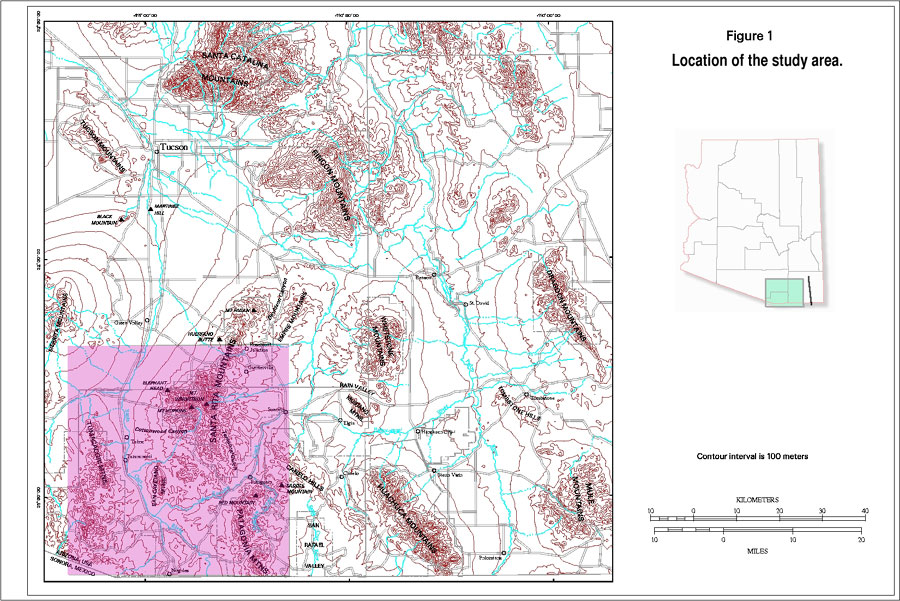
A high resolution aeromagnetic
survey was flown over the Patagonia Mountains, Santa Rita Mountains, upper Santa
Cruz Valley, and Tumacacori Mountains (figure 1) in late 1996 and early 1997
under contract for the U.S. Geological Survey. The data are available to the
public via the Worldwide Web (Sweeney, 2000). Phillips (2001) describes the
processing of this data into a final corrected flight line dataset used for
the work described here. This dataset was used to prepare maps of the aeromagnetic
anomaly field and derivative maps of textural measures that were correlated
with published geological maps to yield the interpretation described in this
report. Measurements of in-situ magnetic properties at a number of sites in
the survey area were completed to help constrain interpretations and provide
model susceptibility values.
Previous studies of the
aeromagnetic field in the area include the aeromagnetic map for the state of
Arizona (Sauck and Sumner, 1970), Ponce (1990), and Gettings (1996). Proprietary
aeromagnetic data flown by a consortium of mineral exploration companies includes
the eastern 20% of the survey area. Primary sources of geologic data for this
study include Drewes (1971, 1980, 1996), Simons (1974), and Gettings and Houser
(1997).
This report introduces several new techniques for characterizing the texture
of magnetic field data in ways that can be used for correlation with lithology
and geologic structure. In order to focus on the techniques, the author has
chosen to organize the report by subject rather than by geographic area or geologic
features. Thus, some areas will be discussed several times at different places
in the report as the results of the application of the various techniques are
discussed. For each technique, a catalog style keyed to the map plates was used
and in general, the order of discussion is the order of the numbered areas or
anomalies on the map plates. This organization allows the reader to ascertain
from which technique a particular interpretive feature was derived and to judge
the relative effectiveness of techniques. Not all anomalies or magnetic field
features have been interpreted or discussed; the dataset contains a great richness
of detail that is beyond the scope of this study to interpret in its entirety.
It is the author’s hope that the most important features have been discussed.
After the presentation of the field measurements of magnetic property data, a comparison of the aeromagnetic anomaly data with the geologic map data is given. This is followed by a trend or lineament analysis of the aeromagnetic anomaly data. Next comes a discussion of the techniques of quantifying two textural measures of the aeromagnetic data and an analysis of the textural measures applied to the aeromagnetic dataset of this study. The report concludes with some generalizations and suggestions for further work.
|
| Figure 1. Index map showing location of study area (in pink). |