By T. Elias and A.J. Sutton
2002
U.S. Geological Survey
Hawaiian Volcano Observatory
Hawaii National Park, HI 96718
Instrumentation
Data collection and reduction
Summit vehicle-based data
East rift vehicle-based data
East rift tripod-based data
East rift and summit fixed-wing measurements
Total Kīlauea SO2 emission rates
Technique comparisons
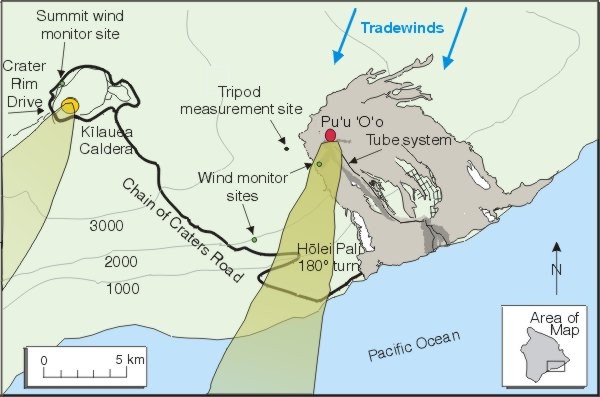
Figure 1. Main degassing sites on Kīlauea Volcano
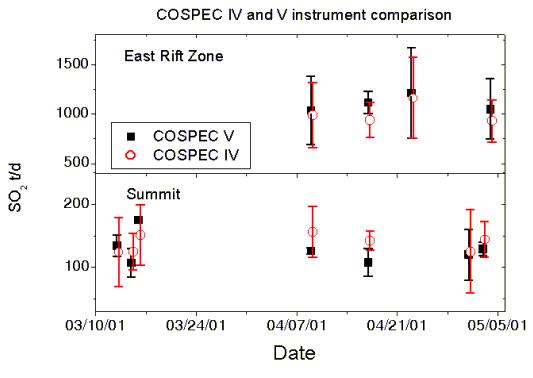
Figure 2. Instrument comparison—COSPEC V and COSPEC IV
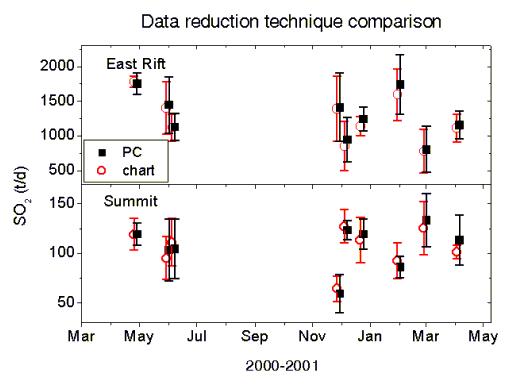
Figure 3. Data reduction technique comparison
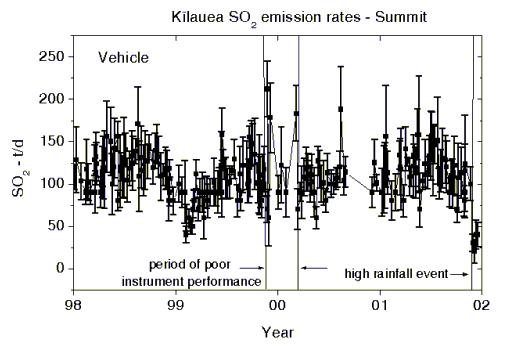
Figure 4. Kīlauea summit SO2 emission rates—vehicle-based, 1998-2001
Figure 5. Wind sensor comparison—ultrasonic and RM Young propeller/vane
Figure 6. Kīlauea ERZ SO2 emission rates—vehicle-based, 1998-2001
Figure 7. Kīlauea ERZ and summit SO2 emission rates—with FFT smoothing, 1998-2001
Figure 8. Kīlauea ERZ SO2 emission rates—vehicle/tripod comparison, 1998-1999
Figure 9. COSPEC orientation—flat vs. sideways
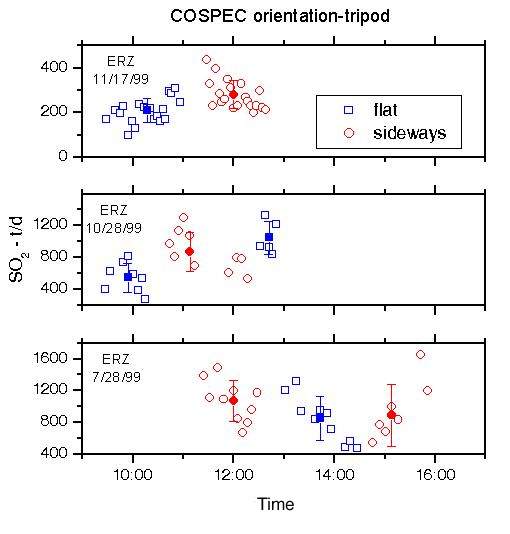
Figure 10. Kīlauea ERZ SO2 emission rates—COSPEC orientation comparison, tripod-based
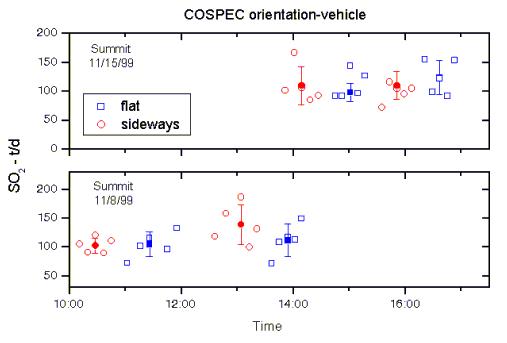
Figure 11. Kīlauea summit SO2 emission rates—COSPEC orientation comparison, vehicle-based
Table 1. Kīlauea summit SO2 emission rates—vehicle based
Table 2. Kīlauea east rift zone SO2 emission rates—vehicle based
Table 3. Kīlauea east rift zone SO2 emission rates—tripod based
Table 4. Kīlauea SO2 emission rates—fixed-wing measurements
Table 5. Estimate of total Kīlauea SO2 emission rates, 1998-2001
Sulfur dioxide (SO2) emission rates from Kīlauea Volcano were first measured by Stoiber and Malone (1975) and have been measured on a regular basis since 1979 (Greenland and others, 1985; Casadevall and others, 1987; Elias and others, 1998; Sutton and others, 2001). A compilation of SO2 emission-rate and wind-vector data from 1979 through 1997 is available as Open-File Report 98-462 (Elias and others, 1998) and on the web at http://hvo.wr.usgs.gov/products/OF98462/. The purpose of this report is to update the existing database through 2001.
Kīlauea releases SO2 gas predominantly from its summit caldera and east rift zone (ERZ) (fig. 1), as described in previous reports (Elias and others, 1998; Sutton and others, 2001). These two distinct sources are quantified independently. The summit and east rift zone emission rates reported here were derived using vehicle-based Correlation Spectrometry (COSPEC) measurements as described in Elias and others (1998). In 1998 and 1999, these measurements were augmented with airborne and tripod-based surveys.
|
|
| Figure 1. Summit and east rift zone of Kīlauea Volcano. From 1979 through 2001, most of the SO2 at Kīlauea was released from the summit caldera and east rift zone. Vehicle-based COSPEC measurements were made on Crater Rim Drive and along Chain of Craters Road during trade-wind conditions to quantify summit and east rift zone SO2 emissions respectively. In 1998 and 1999, airborne and tripod-based surveys made near Pu‘u ‘O‘o augmented the vehicle-based studies. |
We are particularly grateful to the gas geochemistry volunteers at the Hawaiian Volcano Observatory (HVO), who contributed to these 4 years of data, including more than 350 days of measurements and 2300 plume traverses. These measurements were funded under the Volcano Hazards and Global Change Research Programs. Also, many thanks to the University of Hawai‘i, Center for the Study of Active Volcanoes, for the extended use of their newly acquired COSPEC V. The timing of the acquisition was impeccable, as our COSPEC IV, which had faithfully made measurements at HVO for 22 years, began experiencing increasing amounts of instrumental problems.
From 1979, when regular COSPEC measurements began at HVO, through February 27, 2001, SO2 measurements at Kīlauea were made using a COSPEC IV correlation spectrometer, manufactured by Barringer Research Ltd., Toronto, Canada. During the period covered by this report, it was fitted with a high concentration disc assembly, calibration cells of 402 ppm and 1447 ppm, and a Cassegrain telescope.
Beginning on 3/13/01, measurements were made using a COSPEC V, manufactured by Resonance Ltd., which purchased rights to produce the instrument from Barringer in 2000. The COSPEC V is also fitted with a Cassegrain telescope, high concentration disc assembly, and has calibration cells of 410 ppm and 1395 ppm. The newer instrument has several advantages over the COSPEC IV, including a better signal-to-noise ratio, reduced sensitivity to light polarization, and an onboard data-acquisition system.
From 3/13/01-5/3/01, data were collected simultaneously with the COSPEC V and the COSPEC IV. Forty-three traverses were made over 7 days from a vehicle at the summit and ERZ to compare the data from the two COSPEC instruments. The two instruments were run side-by-side, looking either out the side door of a van, or from a vehicle tailgate.
We found no systematic difference in measurements made with the instrument oriented perpendicular vs. parallel to the line of travel of the vehicle. Since our COSPEC IV was experiencing increasing amounts of instrumental noise and baseline drift as 2001 progressed, the comparison of the two instruments was compromised by the poor data quality of the IV. Data collected at the summit were particularly prone to large discrepancies, as the low summit emissions (average=120 t/d) yielded a poorer signal to noise ratio compared to the ERZ data. Individual emission rate measurements for the COSPEC V and IV at the summit had a mean difference of 11 percent, standard deviation (sd)=21 percent, while ERZ measurements had a mean difference of -6 percent, sd=12.6 percent. We attribute the high variability between the instruments in part to the increasing baseline noise, drift, and offset in the COSPEC IV signal that occurred as 2001 progressed.
Figure 2 shows the average SO2 emissions measured by the two instruments on a given day. The vertical bars, which represent the standard deviation of all traverses on a single day, reflect the variability in emission rate, as well as the effects of short-term changes in atmospheric and wind conditions. In contrast to individual traverse comparisons, we note that the difference in the average emission rates for each day of measurements are within the variability of the emissions themselves. Although the COSPEC V produced slightly higher average emission rates than the IV for the ERZ measurements for our comparison runs, no systematic difference between the two instruments was observed for individual traverses. The COSPEC V does yield slightly more variability in emission rates for the ERZ measurement set, as shown by the larger standard deviations measured by the V. No systematic difference between the instruments was observed at the summit, but the emission rates measured by the IV are generally more variable than those measured by the V, at least in part due to the lower signal-to-noise ratio of the IV data.
|
|
| Figure 2. Average SO2 emissions measured by the COSPEC IV (circles) and COSPEC V (squares). The vertical bars represent the standard deviation of all traverses on a single day. Although the COSPEC V and IV traverses were contemporaneous, the data are presented here with a slight temporal offset so that they can be viewed more easily. |
We feel that the accuracy in the calculated SO2 emission rates reported from Kīlauea is not substantially affected by the change in instrumentation. Since we estimate our COSPEC measurements to have an associated uncertainty of 10-30%, the comparison shows that the emission rates calculated with the new COSPEC V are within the error of the measurements made with the old COSPEC IV.
Since mid-1979, when regular COSPEC measurements began at HVO, data have been collected on an analog strip chart recorder and then manually digitized on a digitizing tablet; emission rates were calculated using a Fortran program. We began developing a digital data collection and reduction system in 2000 using a Handar 555 data logger. We wrote a program with a graphical user interface for calculating emission rates using the PC-based software application Origin (Originlab). Starting 3/13/01, all reported data were reduced using the PC-based program. From 4/20/00 to 4/3/01, during hardware testing and refinement and software development, data were reduced sporadically using both the analog strip chart/FORTRAN program and the new PC-based method. The average difference in individual emission rates between the two techniques is 1 percent, sd=11 percent. Average SO2 emissions calculated for the Kīlauea summit and ERZ using the two data reduction techniques are shown in figure 3. Several individuals reduced the data using the two techniques, so some error is attributed to individual differences, which is estimated at ~5 percent (Casadevall and others, 1987).
|
|
| Figure 3. Average SO2 emissions calculated for the Kīlauea summit and ERZ from strip chart and PC-based data reduction techniques, as discussed in text. Although the data are contemporaneous, they are presented here with a slight temporal offset so that they can be viewed more easily. |
Routine digital data collection was streamlined by the COSPEC V data-logging capability, which allows us to capture data directly using a palmtop or notebook computer. However, we continue to use an analog strip chart for in situ plume tracking and as back up in the event of computer failure in the field.
The emission-rate measurements at the summit of Kīlauea were made by vehicle-based COSPEC traverses within the summit caldera along Crater Rim Drive. We generally collect COSPEC data at Kīlauea’s summit when winds are greater than 3 m/s and from directions greater than 340° and less than 50°, as these conditions give rise to the best plume geometry and location. Casadevall and others (1987) and Elias and others (1998) describe details regarding this measurement technique. The data for 1998 through 2001 are shown in table 1 and figure 4.
|
|
| Figure 4. Averaged SO2 emissions (t/d) from Kīlauea’s summit from January 1998 through December 2001. The black vertical bars represent the standard deviation of all traverses on a single day. |
In order to quantify the copious amounts of SO2 released regularly from the ERZ of Kīlauea, the COSPEC is fitted with the high concentration disk assembly and associated calibration cells. This creates a challenge when quantifying the summit emissions, which are an order of magnitude lower than those from the ERZ. The low emissions at the summit cause any increase in background noise to introduce a high error to the measurements. From mid-November 1999 through March 7, 2000, a small but gradual increase in the COSPEC IV noise contributed to poorer quality summit data (fig. 4). The instrument optics and electronics sub-systems were tuned in early March 2000, restoring the COSPEC IV to good working order. The rest of the summit data for 1998 through 2001 are judged to be of good quality.
The low emission rates measured at the end of 2001 (fig. 4) are attributed to a high rainfall event at the summit of Kīlauea (>590 mm over 48 hours on November 27-28). Since SO2 is extremely water soluble, heavy rainfall can lead to the scrubbing of SO2 gas as it rises to the surface through the water-saturated ground. By early January 2002, summit emission rates had returned to more typical values.
Wind velocities at the time of the summit COSPEC measurements were measured using a continuously recording wind monitor located 3.5 meters above the ground and 30 m northwest of the edge of the summit caldera (fig.1). We believe that data from this site give a reasonable representation of wind conditions at the elevation of the plume and contributes to an accurate estimate of the SO2 released from the summit of Kīlauea. Wind parameters were measured 4 m above the ground at several locations along the measurement path in the caldera to confirm that the data from the wind-monitor site were representative. From 1/1/98 through 9/7/01, wind data were collected using a bearing-based wind monitor (RM Young-model 05103). This conventional, helicoid propeller-vane type sensor is an industry standard used by the National Weather Service and other agencies nationwide to monitor wind speed and direction. In December 1999, we co-located an ultrasonic wind sensor (Handar-model 425A) with the conventional sensor on the northwest edge of the caldera. The ultrasonic sensor has no moving parts and thus may prove more consistent and durable in an acidic volcanic environment than the conventional sensor, which uses metal bearings and other parts susceptible to corrosion and wear.
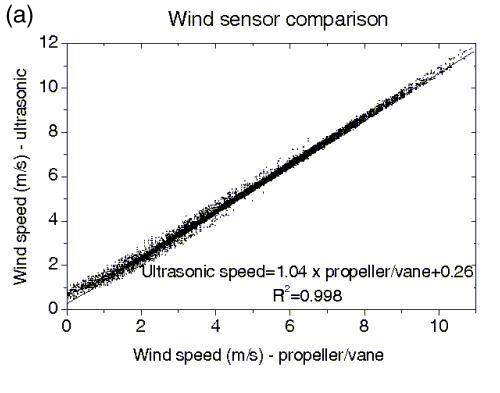
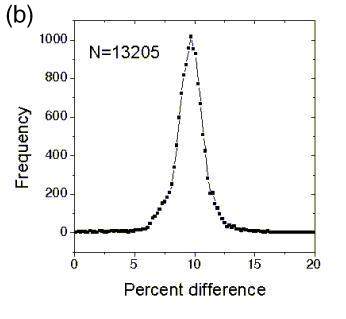
Wind data from the period 1/1/01-9/12/01 show that the ultrasonic sensor yields wind speeds an average of 9.6 percent (sd=1.5 percent) higher than the conventional propeller-vane wind sensor (Fig. 5). However, our wind characterization experiments (Elias and others, 1998), as well as other Kīlauea emission rate studies (Andres and others, 1989; Casadevall and others, 1987), report wind-speed uncertainties between 10% and 20- 30%; therefore, we incorporate the SO2 measurements calculated with ultrasonic wind data into the ongoing 23 year Kīlauea database without further correction. Mean wind direction difference between the sensors was 1.5 percent, sd=3.5 percent. Wind direction has much less impact on calculated emission rates than wind speed, and the variation in emission rates due to wind direction is insignificant.
|
|
Figure 5. Comparison of RM Young propeller/vane-based wind sensor and Handar ultrasonic wind sensor. (a) Wind data from 1/1/01 to 9/12/01 show that the two sensors are linear for all wind speeds. (b) Frequency distribution of the percent difference in wind speed from the two sensors [(WSultrasonic- WSRMYoung) /WSRMYoung x 100] for 13205 data points with speeds greater than 3 m/s. The mean increase from the ultrasonic sensor is 9.6 percent, sd=1.5 percent. | |
 |
||
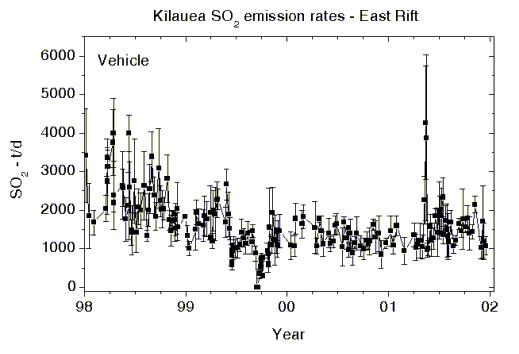
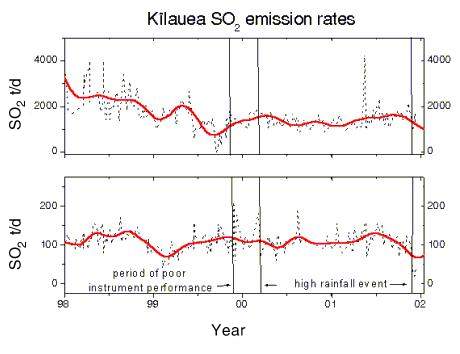
For wind with speeds greater than 5 m/s and directions between 25o and 40o east of north, gases from Pu‘u ‘O‘o typically form a compact plume that crosses Chain of Craters Road above the 180o turn at Holei Pali (fig. 1). This turn marks the beginning of a steep section of the road that traverses down the pali (cliff). Vehicle-based COSPEC data obtained under these conditions typically provide the best-integrated estimate of Kīlauea’s ERZ SO2 release (Elias and others, 1998; Sutton and others, 2001). When wind conditions at Pu‘u ‘O‘o are sufficiently northerly, the entire ERZ plume crosses the Chain of Craters Road below Holei Pali. Often, these conditions yield a plume that clears the pali traveling toward the south, and then is turned toward the west by the easterly along- shore winds. Under these conditions, the plume, at times, lofts high above the road, because of the relief of the steep, 300-m pali. We do not report emission rates when the plume is widespread, with sections both above and below the 180o turn at Holei Pali, because traversing the same section of plume in two directions and at two elevations introduces added uncertainties. East rift zone vehicle-based data is presented in table 2 and figure 6. Figure 7 shows the averaged SO2 emission rate for each day of measurements for the ERZ and summit, as well as the data after it was processed using a non-parametric digital filter and then smoothed using an FFT algorithm. A discussion of the data treatment is presented in Sutton and others, 2001. The low emission rates measured at the summit toward the end of 2001 attributed to high rainfall, were not mirrored in the east rift emissions.
|
|
| Figure 6. Averaged SO2 emissions from Kīlauea’s east rift zone (ERZ) as measured by vehicle-based COSPEC along Chain of Craters Road, 1998 through 2001. The black vertical bars represent the standard deviation of all traverses on a single day. |
|
|
| Figure 7. Kīlauea summit and ERZ emissions for 1998-2001. Averaged SO2 emission for each day of measurements is shown by the light, dotted line. The solid line represents FFT smoothing after data were processed with a non-parametric digital filter. |
COSPEC measurements on Chain of Craters Road are made ~9 km downwind of the vent; therefore, some of the SO2 gas has been converted to sulfate aerosol before reaching the measurement site. Porter and others (2002) used aerosol sun photometry, lidar, and COSPEC measurements along Chain of Craters Road to estimate a SO2 half-life of 6 hours in the atmosphere. For wind speeds of 5-15 m/s, this suggests that ~3-8 percent of the SO2 released from the vent would have converted to aerosol on its journey to the measurement site and would go undetected by the COSPEC.
Contemporaneous wind velocities for plume measurements made above Holei Pali were determined using a continuous wind monitor 3.5 m above the ground, approximately 2.5 km above the 180o turn on Chain of Craters Road (fig. 1). We believe that these data reasonably represent plume velocities above Holei Pali, because under these conditions the east rift plume is frequently close to the ground as it crosses Chain of Craters Road. For measurements made below Holei Pali on the coastal flats, wind conditions were determined using a combination of methods including 1) a portable continuous wind monitor located ~5.7 km below the 180o turn on Chain of Craters Road, 2) 5-minute wind-counter measurements made 4 m above ground level before and/or after a day’s COSPEC traverses, and 3) continuous data from the wind station above the 180o turn on Chain of Craters Road adjusted for observed and measured discrepancies. Contemporaneous wind measurements above and below Holei Pali indicate that 3.5 m winds are often ~25 percent lower along Chain of Craters Road below Holei Pali than above.
On three occasions of brisk kona wind conditions (winds with a southerly component), gases from Pu‘u ‘O‘o formed a reasonably compact plume that crossed Highway 11 between Volcano and Kurtistown, ~20 km downwind (north to north-northeast) of Pu‘u ‘O‘o. For these traverses, wind speeds were measured using the 5-minute wind-counter 4 m above ground directly beneath the densest part of the plume. The uncertainty in wind speed measurements for east rift vehicle-based data is estimated to be 10-30 percent.
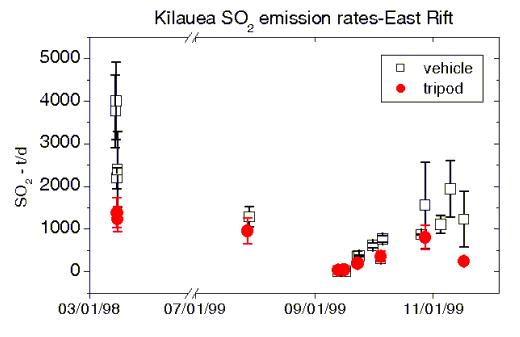
The few tripod-based measurements made during 1998 and 1999 are presented in table 3 and as filled circles in figure 8. A major collapse of Pu‘u ‘O‘o in early 1997 (Heliker and others, 1998) contributed to an already diffuse degassing situation, with multiple vents, fissures, broad shields, tubes and skylights contributing to scattered degassing sources. The tripod-based measurements quantify parts of the plume from Pu‘u ‘O‘o and the upper tube system but leave the contributions along the middle and lower tube system unquantified. These measurements provide important information on vent activity, but generally do not represent all of the east rift emissions.
|
|
| Figure 8. Averaged SO2 emissions from Kīlauea’s east rift zone as measured by tripod- (filled circles) and vehicle-based (open squares) COSPEC for 1998-1999. The black vertical bars represent the standard deviation of all measurements on a single day. |
Tripod-based campaigns during this time period were carried out primarily to support other studies (such as ground truthing for new SO2 measurement techniques) or to provide data when emissions were too low to be quantified 10 km away on Chain of Craters Road. The measurements were made during periods of vigorous activity, eruptive pause, and variable pond activity. The April 1998 data are among the highest tripod-based measurements obtained during non-fountaining eruptive activity (Chartier and others, 1985; Elias and others, 1998; Sutton and others, 2001). The September-October 1999 measurements reflect the slow start-up of the eruption as it resumed on September 23 following an 11-day hiatus. The high variability in both tripod and road-based individual measurements on 10/28/99 coincides with periods of dynamic pond activity. Tripod measurements on this day ranged between 300 t/d and 1300 t/d, with a mean and standard deviation of 800 t/d and 290 t/d respectively, whereas measurements along Chain of Craters Road ranged between 700 t/d and 3300 t/d, with a mean and standard deviation of 1550 t/d and 1020 t/d respectively.
Wind velocities for the tripod-based data were measured with either a portable continuous wind monitor, a wind-counter mounted on a pole 4 m above the ground, or a continuous wind station located 1.5 km south-southwest of Pu‘u ‘O‘o. We determined the distance to, and width of, the plume using helicopter-borne GPS or by visual estimation. All measurements were made from a site ~3 km southwest of Pu‘u ‘O‘o, except for the 10/28/99 data, which were collected ~1.5 km north of our usual tripod site (fig. 1).
Airborne SO2 measurements of gas emissions from the summit and east rift zone of Kīlauea were made in May and June 1998 (table 4), the first such measurements for the summit and east rift zone since 1984 and 1995 respectively (Elias and others, 1998; Sutton and others, 2001). Wind speeds for the fixed-wing measurements were derived from continuous GPS position data taken during wind circle orbits (Doukas, 2002) and upwind/downwind traverses.
On the east rift zone, the vent geometry and multiple degassing sources give rise to a broad plume whose bottom is at ground level (McGee and Gerlach, 1998). Our orbits of Pu‘u ‘O‘o, therefore, yielded SO2 emission rates that represent minimum values, because some SO2 was below the upward-looking COSPEC even on the lowest traverse, approximately 500 feet above ground level (agl). The ERZ airborne SO2 emission rates are consistent with ERZ automobile-based emission rates from data collected on or about the same days.
Fixed-wing measurements flown 1 km downwind of Kīlauea’s caldera detected an unquantifiable amount of SO2 in June, but in May, SO2 was below the detection limit. Wind speeds were somewhat less during the June flight, causing the top of the plume to loft as high as 1525 m (520 m agl), whereas during the May flight, CO2 measurements indicated that the top of the plume was at 1070 m (60 m agl).
Table 5 provides an estimate of the integrated yearly SO2 emission rates for Kīlauea during 1998-2001. Annual emission rates were calculated by summing the daily emission rates calculated using the filtered, FFT smoothed data for the summit and east rift.
As observed for earlier datasets (Andres and others, 1989; Elias and others, 1998; Sutton and others, 2001), Kīlauea emission rates based on tripod measurements are generally lower than those based on vehicle measurements along Chain of Craters Road (fig. 8). An exception to this was observed as the eruption slowly resumed following the 11-day pause in September 1999. During this time, a thin wispy plume was released from Pu‘u ‘O‘o, with minimal degassing from other locations. We were able to make measurements from a site relatively close to the plume, 100-800 m away, under varying conditions. The plume itself was reasonably compact at 150-600 m width. We found that tripod- and vehicle-based measurements agreed well when the plume was thin and emission rates were low, but the two techniques were less consistent once the plume increased in width and density.
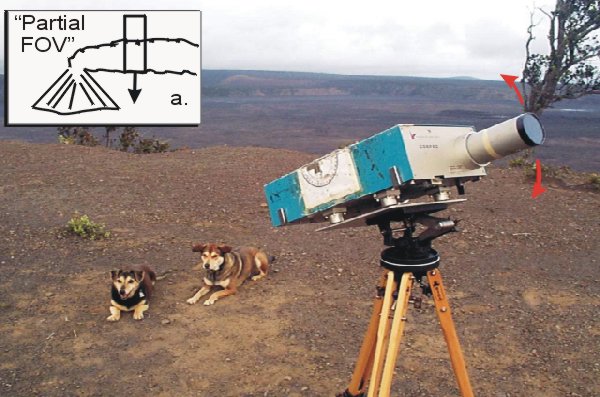
Errors due to the COSPEC field of view (FOV) orientation can contribute to artificially low measured burdens (Millan and Hoff, 1978; Sutton and others, 2001). To determine the contribution of this effect, we made a series of measurements to compare scans collected with an instrument oriented flat, with the light entrance slits perpendicular to the horizontally moving plume, and with the COSPEC mounted on its side, so that the entrance slits were parallel to the plume axis (fig. 9). The flat configuration (fig. 9a) can result in a "partial FOV" effect; since the FOV has an aspect-ratio of 3:1, the COSPEC disproportionately combines radiant energy from clear sky with plume signal, effectively diluting the plume edges and resulting in artificially low measured burdens (Millan and Hoff, 1978). The original instrument manufacturer, Barringer, Ltd., recommends that the flat configuration be avoided when making tripod-based scans (Bob Dick, 1997, pers. com.).
 |
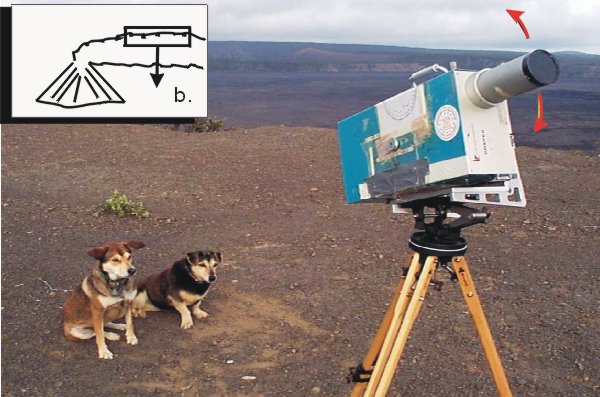 |
| Figure 9. COSPEC IV oriented flat (a), with the light entrance slits perpendicular to the horizontally moving plume, and with the COSPEC mounted on its side (tipped) (b), so that the entrance slits are parallel to the plume axis. Red arrows indicate direction of plume scans. |
A total of 90 tripod-based measurements on three separate days showed that for the Pu‘u ‘O‘o plume measured from 200-1200 m away, the variability in emission source and other technique variables were greater than the variability due to the COSPEC orientation (fig.10). There was no statistically significant difference in the data from the two distinct orientations.
|
|
| Figure 10. Individual SO2 emission-rate measurements from Kīlauea’s east rift zone collected using a tripod-based COSPEC oriented flat (open squares) or sideways (open circles). Filled squares (flat), filled circles (sideways), and vertical bars represent averaged emission rate and standard deviation for a series of measurements. |
A series of measurements was also made at the summit, where the SO2 emission rate is more consistent, and the plume is closer. Forty traverses were made using a vehicle-based COSPEC oriented in the conventional flat, as well as the sideways, configuration. These results also showed that the difference in calculated emission rates using the two orientations was not statistically significant (fig. 11).
|
|
| Figure 11. Individual SO2 emission-rate measurements from Kīlauea’s summit as measured by vehicle-based COSPEC oriented flat (open squares) or sideways (open circles). Filled squares (flat), filled circles (sideways), and vertical bars represent averaged emission rate and standard deviation for a series of measurements. |
Casadevall, T.J., Stokes, J.B., Greenland, L.P., Malinconico, L.L., Casadevall, J.R., and Furukawa, B.T., 1987, SO2 and CO2 emission rates at Kīlauea Volcano, 1979-1984, chap. 29 in Decker, R.W., Wright, T.L., and Stauffer, P.H., eds., Volcanism in Hawaii: U.S. Geological Survey Professional Paper 1350, v. 1, p. 771-780.
Chartier, T.A., Rose, W.I., and Stokes, J.B., 1985, SO2 emission rates at Pu‘u ‘O‘o vent, Kīlauea between east rift zone phases 33 and 34 [abs.]: Eos, Transactions, American Geophysical Union, v. 66, no. 46, p. 1132.
Doukas, M.P., 2002, A new method for GPS-based wind speed determinations during airborne volcanic plume measurements. U.S. Geological Survey Open-File Report 02-395.
Elias, T., Sutton A. J., Stokes, J.B., Casadevall, T.J., 1998, Sulfur dioxide emission rates of Kīlauea Volcano, Hawaii, 1979-1997. U.S. Geological Survey Open-File Report 98-462.
Greenland, P., Rose, W.I., and Stokes, J.B., 1985, An estimate of gas emissions and magmatic gas content from Kīlauea Volcano: Geochimica et Cosmochimica Acta, v. 49, p. 125-129.
Heliker, C. C., J. P. Kauahikaua, J.P., Sherrod, D.R., Thornber, C.R. 1998, The rise and fall of Pu‘u ‘O‘o cone, Kīlauea Volcano, 1983-1998 [abs.]. Eos, Transactions, American Geophysical Union supp. v. 79(no. 45): p. F956.
McGee, K.A., and Gerlach, T.M., 1998, Airborne volcanic plume measurements using a FTIR spectrometer, Kīlauea volcano, Hawaii: Geophysical Research Letters, v. 25, no. 5, p. 615-618.
Millan, M. M. and Hoff , R. M., 1978, Remote sensing of air pollutants by correlation spectroscopy - instrumental response characteristics. Atmospheric Environment v. 12: 853-864.
Porter, J. N., Horton, K. A., Mouginis-Mark, P. J., Lienert, B., Sharma, S. K., Lau, E., Sutton, A. J., Elias, T., Oppenheimer, C., 2002, Sun Photometer and Lidar Measurements of the Plume from the Hawaii Kīlauea Volcano Pu‘u ‘O‘o Vent: Aerosol Flux and SO2 Lifetime. Geophysical Research Letters, 29 (16), 1783, doi:10.1029/2002GLO14744
Stoiber, R.E., and Malone, G.B., 1975, Sulfur dioxide emissions at the crater of Kīlauea, at Mauna Ulu, and at Sulfur Banks, Hawaii [abs.]: Eos, Transactions, American Geophysical Union, v. 56, no. 6, p. 461.
Sutton, A. J., Elias, T., Gerlach, T.M., Stokes, J.B., 2001, Implications for eruptive processes as indicated by sulfur dioxide emission from Kīlauea volcano, Hawaii, USA, 1979-1997. Journal of Volcanology and Geothermal Research v.108: 283-302.
| Department of the Interior | U.S. Geological Survey
URL of this page: https://pubs.usgs.gov/of/2002/of02-460/of02-460.html
Maintained by: Michael Diggles
Created: December 27, 2002 (cad)
Last modified: April 24, 2007 (mfd)