
AVIRIS DATA CALIBRATION INFORMATION:
Wasatch Mountains and Park City
Region, Utah
by Barnaby W. Rockwell1, Roger N.
Clark, K. Eric Livo, Robert R. McDougal, and Raymond F. Kokaly
Open-File Report 02-199
2002
This report is preliminary and has not been reviewed for
conformity with U.S. Geological Survey editorial standards or with the
North American Stratigraphic Code. Any use of trade, firm, or product
names is for descriptive purposes only and does not imply endorsement by
the U.S. Government.
U.S. DEPARTMENT OF THE INTERIOR
U.S. GEOLOGICAL SURVEY
1barnabyr@usgs.gov,
Denver, Colorado
This report contains information regarding the reflectance calibration
of spectroscopic imagery acquired over the Wasatch Mountains and Park City
region, Utah, by the Airborne Visible/Infrared Imaging Spectrometer (AVIRIS)
sensor on August 5, 1998. This information was used by the USGS Spectroscopy
Laboratory to calibrate the Park City AVIRIS imagery to unitless reflectance
prior to spectral analysis. The Utah AVIRIS data were analyzed as
a part of the USEPA-USGS
Utah Abandoned Mine Lands Imaging Spectroscopy Project.
The following is a summary of the procedures used by the USGS Spectroscopy
Lab to calibrate spectroscopic image data to reflectance. These procedures
will result in the generation of multiplier and offset spectra which can
be used to convert to reflectance an imaging spectrometer data cube which
has been previously atmospherically corrected using published or COTS MODTRAN-based
software such as ATREM (Gao and Goetz, 1990; Gao et al., 1992).
-
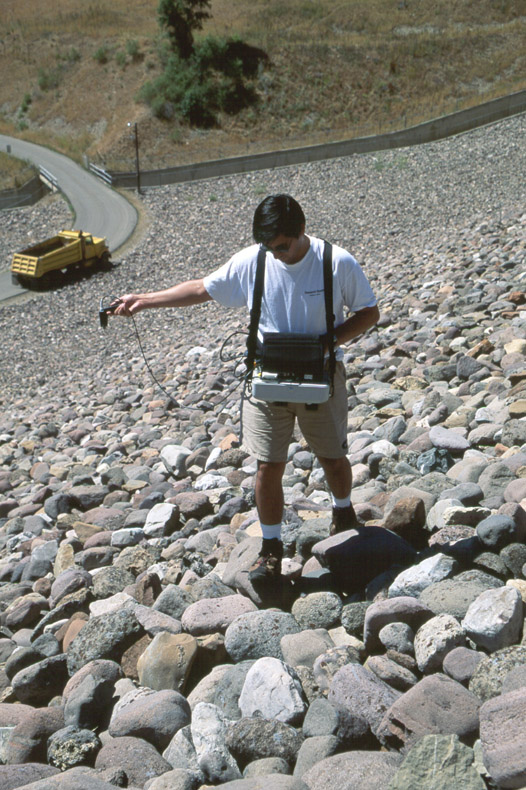
1. Using field spectrometer with spectral range and bandpass similar
to that of the imaging spectroscopy data being calibrated, characterize
a ground calibration site covered by the image data. An optimal calibration
site is large, spectrally bland, and homogenous (e.g. tarps, gravel parking
lots, beaches, salt flats, playas, gravel pits, dam faces, intersections
of dirt roads, etc.)
-
2. View field spectra and delete ones with obvious errors.
-
3. Average remaining field spectra.
-
4. Use spectral editing program to remove small glitches in average
spectrum related to residual atmospheric absorptions and/or sensor noise
or artifacts.
-
5. Multiply glitch-free average spectrum by Spectralon correction
spectrum (spectrum of white plate used to calibrate field spectrometer
to reflectance units).
-
6. Convolve result of step #5 to the sampling interval and bandpass
of the imaging spectroscopy data being calibrated.
-
7. PATH RADIANCE CORRECTION. Locate a dark, shadowed, and vegetated
area in your ATREM-corrected image data set (scaled by 20,000) and extract
representative spectra. Average these spectra together.
-
8. Use spectral editing program to visually estimate a "true" shape
for the average of shadowed vegetation pixels generated in step #7.
ATREM over-corrects for path radiance, resulting in a drastic reflectance
fall-off below ~0.55 microns (sometimes the fall-off starts at as high
as 0.7 microns). This fall-off must be removed.
-
9. CALULATE OFFSET SPECTRUM. Subtract edited, "corrected" spectrum
of dark vegetation (result of step #8) from original, un-edited spectrum.
-
10. Extract spectra of field calibration site from ATREM-corrected
image data cube. Average these spectra together.
-
11. Subtract OFFSET spectrum (result of step #9) from average image
spectrum of calibration site generated in step #10.
-
12. CALCULATE MULTIPLIER SPECTRUM. Divide edited field spectrum
of calibration site (result of step #6) by the image spectrum of calibration
site from which ATREM path radiance overcorrections have been removed (result
of step #11).
-
13. Apply MULTIPLIER and OFFSET to ATREM-corrected imaging spectrometer
data (see flowchart):
-
13a. Apply radiative transfer corrections to the radiance data supplied
by JPL by running the ATREM program, using the ATREM command file shown
below.
-
13b. Download the offset and multiplier spectra provided below.
-
13c. Subtract the offset spectrum from the ATREM-corrected cube.
-
13d. Multiply the results of Step 13c by the multiplier spectrum.
-
13e. Multiply the results of Step 13d by a scaling factor of 20,000.
This step allows the reflectance data to be stored with full dynamic range
in unsigned integer format (2 bytes per pixel) rather than floating point
format (4-bytes per pixel), reducing data storage requirements.
Information contained on this page:
IMPORTANT NOTES:
-
All pixel locations are given in line, sample (y, x) format where the origin
(pixel 1,1) is the upper left pixel of the image.
-
Pixel locations apply to the two-scene blocks shown in this
image, which also shows the calibration site.
Photo of calibration site: Deer Creek Reservoir
dam face

Photo showing dam face surface and spectral
measurement technique
Average spectrum of calibration site acquired
with ASD field spectrometer
 Larger
12 KB image
Larger
12 KB image
-
Click HERE
for edited average ASD spectrum of the Deer Creek reservoir dam face calibration
site in ascii format (shown in green above).
Channel number, wavelength, and FWHM values for
1998 AVIRIS data
Click HERE for an ascii
listing of information regarding 1998 AVIRIS channels. This information
comprises the "waves.um.98" file required to run ATREM using the command
file shown below. Column descriptions are as follows:
| Channel Number |
Wavelength center
position (microns) |
FWHM (microns) |
Wavelength uncertainty |
FWHM uncertainty |
Channel Number |
ATREM command file used to apply atmospheric radiative
transfer corrections to radiance data
AVIRIS
20.00                           ! plane altitude (in km, above sea level)
08 05 1998 18 40 30             ! date/time (month day year hour minute second)
40 35 48                        ! latitude (degrees minutes seconds)
N                               ! earth hemisphere (N or S)
111 25 42                       ! longitude (degrees minutes seconds)
W                               ! earth hemisphere (E or W)
0.                              ! average spectral resolution (nm) or "0"
waves.um.98                     ! 1998 AVIRIS wavelength file (microns)
1                               ! channel ratio parameters (0 or 1)
0.9140 3 0.9815 3 0.943 3       ! .94 um water vapor band ratio parameters
1.0870 3 1.173 3 1.125 3        ! 1.14 um water vapor band ratio parameters

2                               ! atmospheric model
1 1 1 1 1 1 1                   ! gas selectors
0.34                            ! total column ozone amount (atm-cm)
1 200                           ! aerosol model and visibility (km)
1.792                           ! average elevation of scene surface (in km)
pc98_r4s4-3_rad.v               ! input image cube in radiance units
0                               ! read AVIRIS input data dims from vicar hdr
pc98_r4s4-3_atrem               ! output image cube in scaled reflectance units
0.                              ! spectral resolution (nm) of output data
20000.                          ! scale factor of output reflectance data
pc98_r4s4-3_atrem.vap           ! output water vapor image
AVIRIS image showing pixels selected for averaging
to characterize calibration site

Calibration Site: Deer Creek reservoir dam
face.
The area shown in red corresponds to the area characterized with the
field spectrometer. See below for an ascii list of the pixels shown
in red.
Ascii list of AVIRIS pixels averaged to characterize
calibration site
Click HERE
for an ascii list of coordinates of the 57 AVIRIS pixels averaged to characterize
the calibration site. These coordinates are relative to the upper left
(NW) corner of AVIRIS scene pc98_r2s2-1_rtgc.
ATREM-corrected AVIRIS spectrum of calibration
site
 Larger
15 KB image
Larger
15 KB image
-
Click HERE
for an ATREM-corrected average AVIRIS spectrum of the Deer Creek reservoir
dam face calibration site in ascii format.
-
The ATREM-corrected spectra of the pixels shown in red above were averaged
to produce the spectrum shown here.
AVIRIS image of dark target showing pixels selected
to estimate ATREM path radiance over-correction
-
The dark target pixels of shadowed vegetation shown above were selected
from AVIRIS scene pc98_r4s4-3_rtgc.
-
See below for an ascii list of these pixels.
Ascii list of AVIRIS pixels averaged to characterize
dark target
Click HERE
for an ascii list of coordinates of the AVIRIS pixels averaged to characterize
the dark target. These coordinates are relative to the upper left (NW)
corner of AVIRIS scene pc98_r4s4-3_rtgc.
Original derived MULTIPLIER spectrum
 Larger
14 KB image
Larger
14 KB image
-
Click HERE for
the multiplier spectrum in ascii format.
 New derived MULTIPLIER spectrum
 Larger
16 KB image
Larger
16 KB image
-
This new multiplier spectrum corrects for a small residual positive feature,
or "hump" centered near 1.45 microns. This region is important for the
mapping of alunites and other sulfates.
-
Click HERE for the
multiplier spectrum in ascii format.
Derived OFFSET spectrum
 Larger
15 KB image
Larger
15 KB image
-
Click HERE for
the offset spectrum in ascii format.
References:
Gao, B.C., and Goetz, A.F.H., 1990, Column atmospheric water vapor and
vegetation liquid water retrievals from airborne imaging spectrometer data:
J. Geophys Res. 95, pp. 3549-3564.
Gao, B.C., Heidebrecht, K.B., Goetz, A.F.H., ATmospheric REMoval Program
(ATREM) User's Guide, 1992, Center for the Study of Earth From Space document,
University of Colorado, version 1.1, 24pp.
U.S. Geological Survey, a bureau
of the U.S. Department of the Interior
Last modified May 9, 2002.