
by Barnaby W. Rockwell1, Roger N. Clark, K. Eric Livo, Robert R. McDougal, and Raymond F. Kokaly
Open-File Report 02-200
2002
This report is preliminary and has not been reviewed for conformity with U.S. Geological Survey editorial standards or with the North American Stratigraphic Code. Any use of trade, firm, or product names is for descriptive purposes only and does not imply endorsement by the U.S. Government.
U.S. DEPARTMENT OF THE INTERIOR
U.S. GEOLOGICAL SURVEY
1barnabyr@usgs.gov, Denver, Colorado
This report contains information regarding the reflectance calibration of spectroscopic imagery acquired over the Oquirrh and East Tintic Mountains, Utah, by the Airborne Visible/Infrared Imaging Spectrometer (AVIRIS) sensor on August 5, 1998. This information was used by the USGS Spectroscopy Laboratory to calibrate the AVIRIS imagery to unitless reflectance prior to spectral analysis. The Utah AVIRIS data were analyzed as a part of the USEPA-USGS Utah Abandoned Mine Lands Imaging Spectroscopy Project.
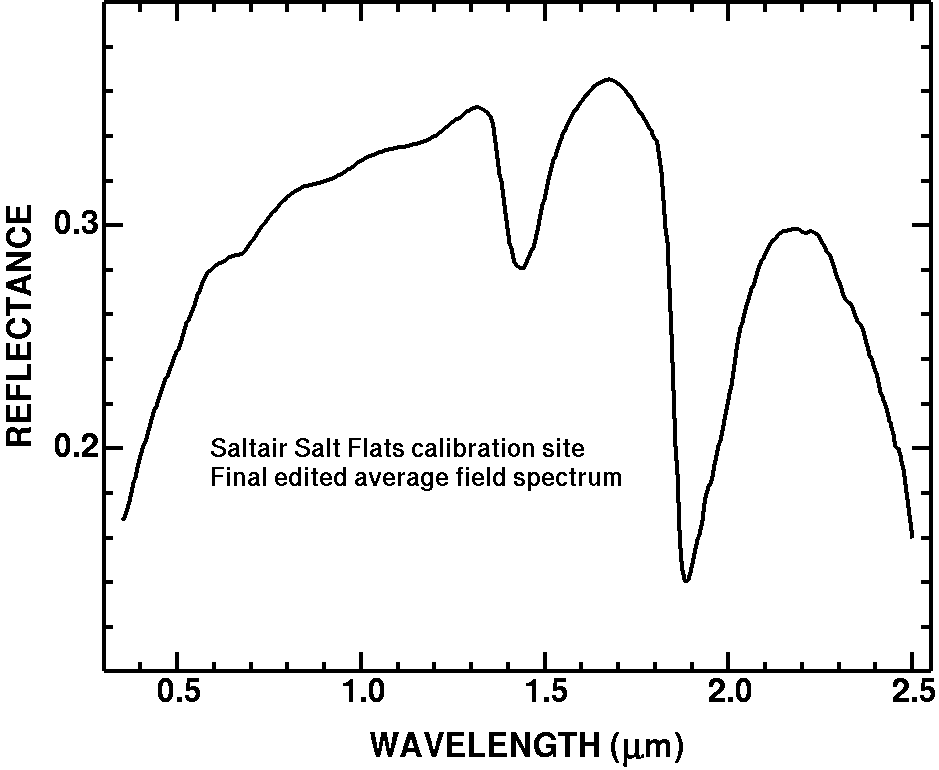
The information contained herein pertains to the original reflectance calibration derived solely from the Saltair beach site on the shores of Great Salt Lake. The reflectance data derived from this calibration becomes markedly affected by residual absorptions due to atmospheric water vapor and carbon dioxide within short horizontal and vertical distances from the calibration site due to the presence of what is believed to be a distinct microclimate by the lake. Subsequent to the development of this web site, a new reflectance calibration was derived which mitigated these effects. Reflectance spectra of bright areas of known composition in the East Tintic Mountains, far from Great Salt Lake, were sampled from the calibrated high altitude AVIRIS data cubes and edited, or "polished," to identify artifacts related to residual absorptions of atmospheric gases, particulates, and sensor noise. The subtle artifacts identified in this way were incorporated into the multiplier spectra derived from the original calibration site, generating new multiplier spectra that were used to re-calibrate the ATREM- and path radiance-corrected cubes to reflectance. This process generated a reflectance calibration customized for the Oquirrh/East Tintic Mountain region.
Information contained on this page:
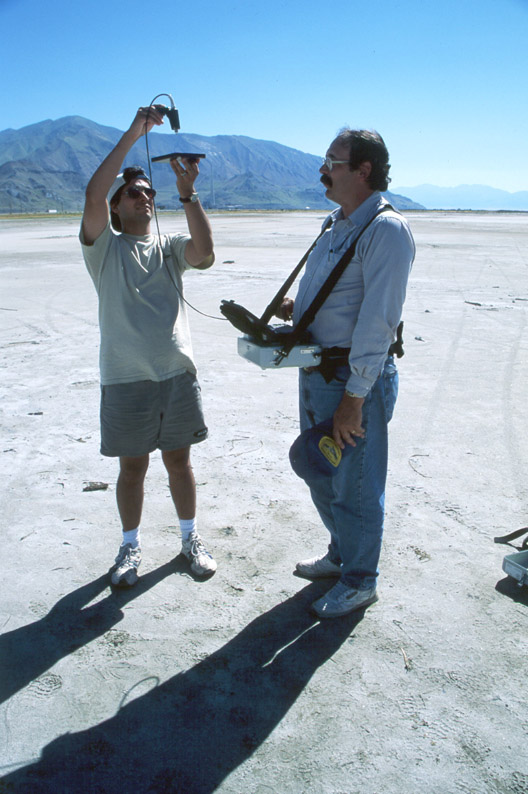
The northern Oquirrh Mountains and the Magna Smelter are visible in the background. The USGS scientists are shown in the process of calibrating the field spectrometer to reflectance units. The Spectralon white plate is held high to reduce the possibility of spectral contamination due to reflections of light from clothing and skin.
Click HERE for an ascii
listing of information regarding 1998 AVIRIS channels. This information
comprises the "waves.um.98" file required to run ATREM using the command
file shown below. Column descriptions are as follows:
| Channel Number | Wavelength center
position (microns) |
FWHM (microns) | Wavelength uncertainty | FWHM uncertainty | Channel Number |
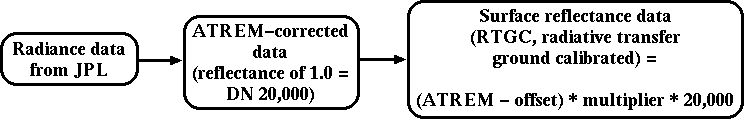
AVIRIS
20.00                           ! plane altitude (in km, above sea level)
08 05 1998 19 12 48             ! date/time (month day year hour minute second)
40 48 04                        ! latitude (degrees minutes seconds)
N                               ! earth hemisphere (N or S)
112 07 31                       ! longitude (degrees minutes seconds)
W                               ! earth hemisphere (E or W)
0.                              ! average spectral resolution (nm) or "0"
waves.um.98                     ! 1998 AVIRIS wavelength file (microns)
1                               ! channel ratio parameters (0 or 1)
0.9140 3 0.9815 3 0.943 3       ! .94 um water vapor band ratio parameters
1.0870 3 1.173 3 1.125 3        ! 1.14 um water vapor band ratio parameters
2                               ! atmospheric model
1 1 1 1 1 1 1                   ! gas selectors
0.34                            ! total column ozone amount (atm-cm)
1 200                           ! aerosol model and visibility (km)
1.90                            ! average elevation of scene surface (in km)
../CUBE/om98_r6_s12_11_rad.v    ! input image cube in radiance units
0                               ! read AVIRIS input data dims from Vicar hdr
../CUBE/om98_r6_s12_11.ATREM3   ! output image cube in scaled reflectance units
0.                              ! spectral resolution (nm) of output data
20000.                          ! scale factor of output reflectance data
om98_r6_s12_11.h2o.vap          ! output water vapor image
![]()
Calibration Site: Saltair beach, Great Salt Lake.
The area shown in red corresponds to the area characterized with the field spectrometer. See below for an ascii list of the pixels shown in red.
Click HERE for an ascii list of coordinates of the AVIRIS pixels averaged to characterize the calibration site. These coordinates are relative to the upper left (NW) corner of AVIRIS scene om98_r6_s12-11.rtgc.
![]()
Click HERE for an ascii list of coordinates of the AVIRIS pixels averaged to characterize the dark target. These coordinates are relative to the upper left (NW) corner of AVIRIS scene om98_r6_s10-9.rtgc.
References:
Gao, B.C., and Goetz, A.F.H., 1990, Column atmospheric water vapor and vegetation liquid water retrievals from airborne imaging spectrometer data: J. Geophys Res. 95, pp. 3549-3564.
Gao, B.C., Heidebrecht, K.B., Goetz, A.F.H., ATmospheric REMoval Program (ATREM) User's Guide, 1992, Center for the Study of Earth From Space document, University of Colorado, version 1.1, 24pp.
U.S. Geological Survey, a bureau
of the U.S. Department of the Interior
Last modified May 9, 2002.


