![]()
![]()
South Dakota Complete Bouguer Gravity Anomaly Map
![]()
Northeast Illumination
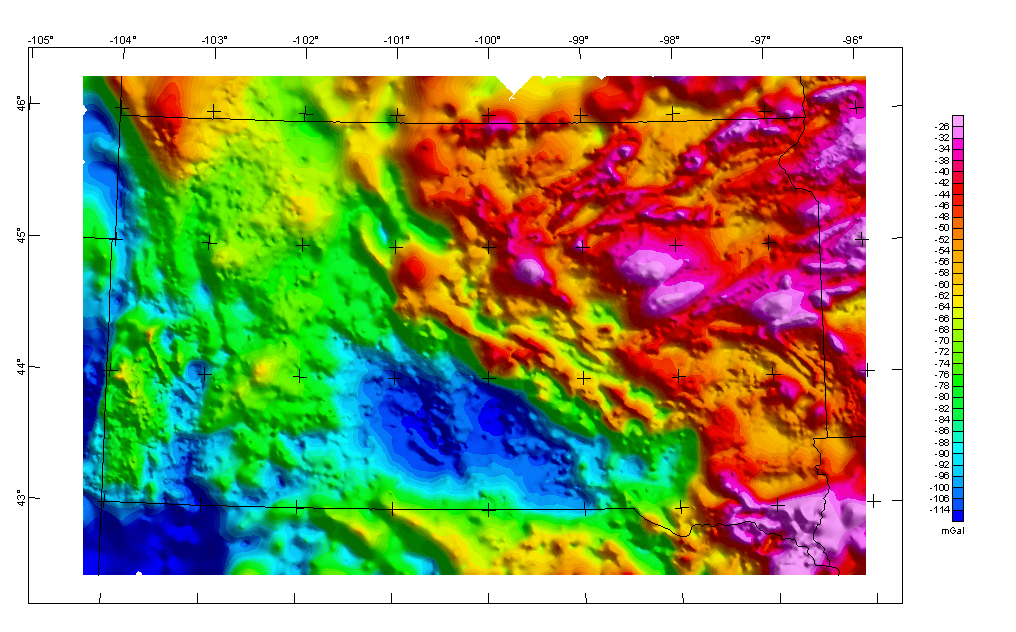
The colors on this Bouguer gravity anomaly map represent gravity variations resulting from lateral density variations in the Earth. Positive anomalies (red colors) occur in areas with average density greater than the Bouguer reduction density of 2.45 gm/cc, whereas negative anomalies (blue colors) occur in areas of lower density.
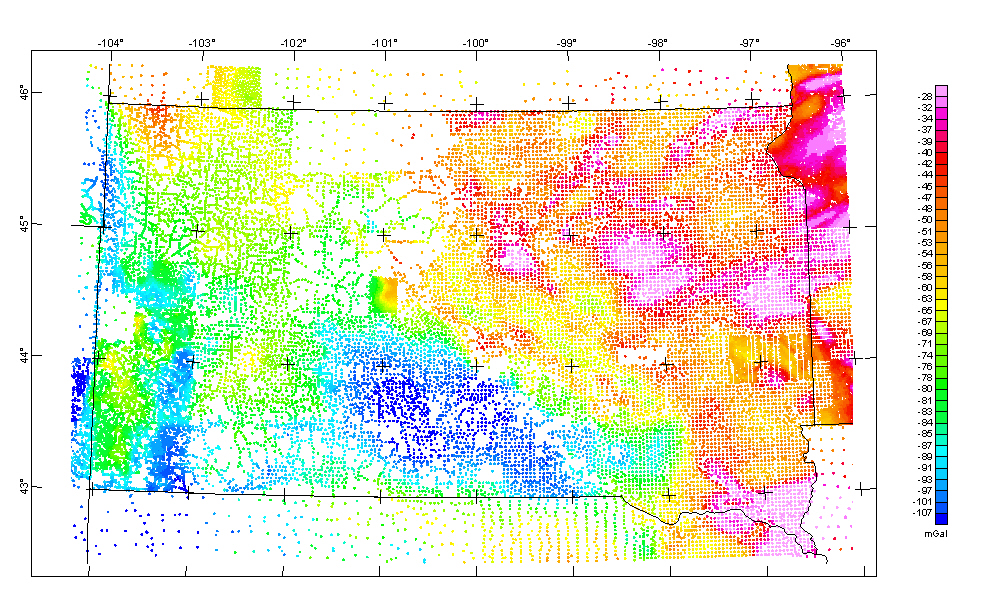
The complete-Bouguer gravity anomaly grid was generated from 28,514 gravity station measurements in and adjacent to the state of South Dakota. 12,251 stations were contracted through the South Dakota Geological Survey and published by the USGS (Kucks and Zawislak, 2001) , 14,239 stations were extracted from the gravity data base maintained by the National Geophysical Data Center (from Department of Defense unclassified data) (Hittleman and others, 1994) , and another 2,024 were converted to the complete-Bouguer anomaly from maps of Hazelwood (Hildenbrand and Kucks, 1981). Observed gravity measurements relative to the IGSN-71 datum were reduced to the Bouguer anomaly using the 1967 gravity formula (Cordell and others, 1982) and a reduction density of 2.45 gm/cc. Terrain corrections were calculated radially outward from each station to a distance of 167 km using a method developed by Plouff (1977). The data were converted to a 1-km grid using minimum curvature techniques. This compilation does not include any unpublished data.
Grids for this map in various formats are available from the data directory as grvcba.***
Top || South Dakota home || Crustal Team || Geology || USGS