Open-File Report 02-286
U.S. Geological Survey Open-File Report 02-286 (Published 2002)
By Curtis L. Sanders
![]() This report is available online in pdf format (1 MB): USGS OFR 02-286.pdf
This report is available online in pdf format (1 MB): USGS OFR 02-286.pdf
A method used by the U.S. Geological Survey for quality control in computing daily value flow records is to compare hydrographs of computed flows at a station under review to hydrographs of computed flows at a selected index station. The hydrographs are placed on top of each other (as hydrograph overlays) on a light table, compared, and missing daily flow data estimated. This method, however, is subjective and can produce inconsistent results, because hydrographers can differ when calculating acceptable limits of deviation between observed and estimated flows. Selection of appropriate index stations also is judgemental, giving no consideration to the mathematical correlation between the review station and the index station(s).
To address the limitation of the hydrograph overlay method, a set of software programs, written in the SAS macrolanguage, was developed and designated Program HYDCOMP. The program automatically selects statistically comparable index stations by correlation and regression, and performs hydrographic comparisons and estimates of missing data by regressing daily mean flows at the review station against -8 to +8 lagged flows at one or two index stations and day-of-week. Another advantage that HYDCOMP has over the graphical method is that estimated flows, the criteria for determining the quality of the data, and the selection of index stations are determined statistically, and are reproducible from one user to another.
HYDCOMP produces a file and list of the five most-correlated index stations for each station in the State, prioritized by standard error of estimate of the regression. Initially, HYDCOMP will load the most-correlated index stations into another file containing the bestindex stations, but will not overwrite stations already in the file. A knowledgeable user should delete unsuitable index stations from this file based on standard error of estimate, hydrologic similarity of candidate index stations to the review station, and knowledge of the individual station characteristics. Also, the user can add index stations not selected by HYDCOMP, if desired.
Once the file of best-index stations is created, a user may do hydrographic comparison and data estimates by entering the number of the review station, selecting an index station, and specifying the periods to be used for regression and plotting. For example, the user can restrict the regression to ice-free periods of the year to exclude flows estimated during iced conditions. However, the regression could still be used to estimate flow during iced conditions.
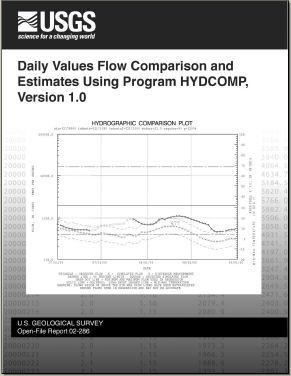
HYDCOMP produces the standard error of estimate as a measure of the central scatter of the regression and R-square (coefficient of determination) for evaluating the accuracy of the regression. Output from HYDCOMP includes plots of percent residuals against (1) time within the regression and plot periods, (2) month and day of the year for evaluating seasonal bias in the regression, and (3) the magnitude of flow. For hydrographic comparisons, it plots 2-month segments of hydrographs over the selected plot period showing the observed flows, the regressed flows, the 95 percent confidence limit flows, flow measurements, and regression limits. If the observed flows at the review station remain outside the 95 percent confidence limits for a prolonged period, there may be some error in the flows at the review station or at the index station(s). In addition, daily minimum and maximum temperatures and daily rainfall are shown on the hydrographs, if available, to help indicate whether an apparent change in flow may result from rainfall or from changes in backwater from melting ice or freezing water.
HYDCOMP statistically smooths estimated flows from non-missing flows at the edges of the gaps in data into regressed flows at the center of the gaps using the Kalman smoothing algorithm. Missing flows are automatically estimated by HYDCOMP, but the user also can specify that periods of erroneous, but nonmissing flows, be estimated by the program.
Abstract
Introduction
Purpose and scope
Statistical methods
Program description
Program execution
Selection of the five most-correlated index stations for every station in the state using Option 4
Methods for determining the most-correlated index stations
Data entry for Option 4
Displaying the five most-correlated stations for each station in the state using Option 5
Methods for Selecting the best index stations from the most-correlated index stations
Data entry, hydrographic comparison, and estimates of missing data using Options 1, 2, and 3
How to enter data on screen 1 for Options 1, 2, and 3
How to enter data on screen 2 for Options 1 and 2
How to analyze tabular and graphic output from Options 1 and 2
Summary
References
Appendix 1: Program software components
Appendix 2: Program installation
Appendix 3: Program maintenance
![]() This report is available online in pdf format (1 MB): USGS OFR 02-286
This report is available online in pdf format (1 MB): USGS OFR 02-286
To view the PDF document, you need the Adobe Acrobat® Reader installed on your computer. (A free copy of the Acrobat® Reader may be downloaded from Adobe Systems Incorporated.)
For more information, contact the South Carolina Publications Unit.
![]() USGS South Carolina Publications • South Carolina Water Science Center
USGS South Carolina Publications • South Carolina Water Science Center

![]() U.S. Department of the Interior |
U.S. Geological Survey
U.S. Department of the Interior |
U.S. Geological Survey
URL: http://pubsdata.usgs.gov/pubs/of/2002/ofr02-286/index.html
Page Contact Information: S.C. Water Science Center
Page Last Modified: Wednesday, 07-Dec-2016 19:21:24 EST
