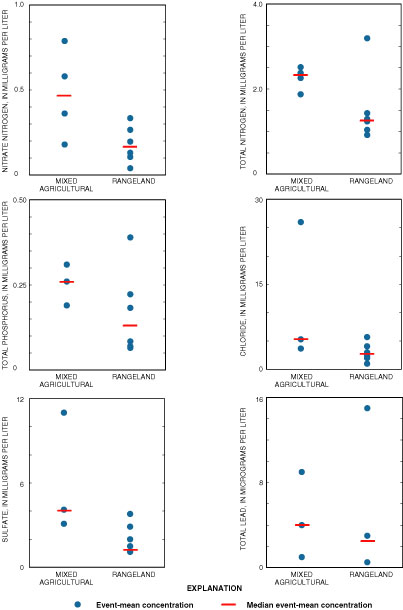
Figure 5. Comparison of runoff concentrations for selected constituents between mixed agricultural watershed (Moody Creek watershed) and rangeland watersheds (watersheds 1 and 2), 2000–2001.
Back to Table of Contents | Hydrologic Conditions