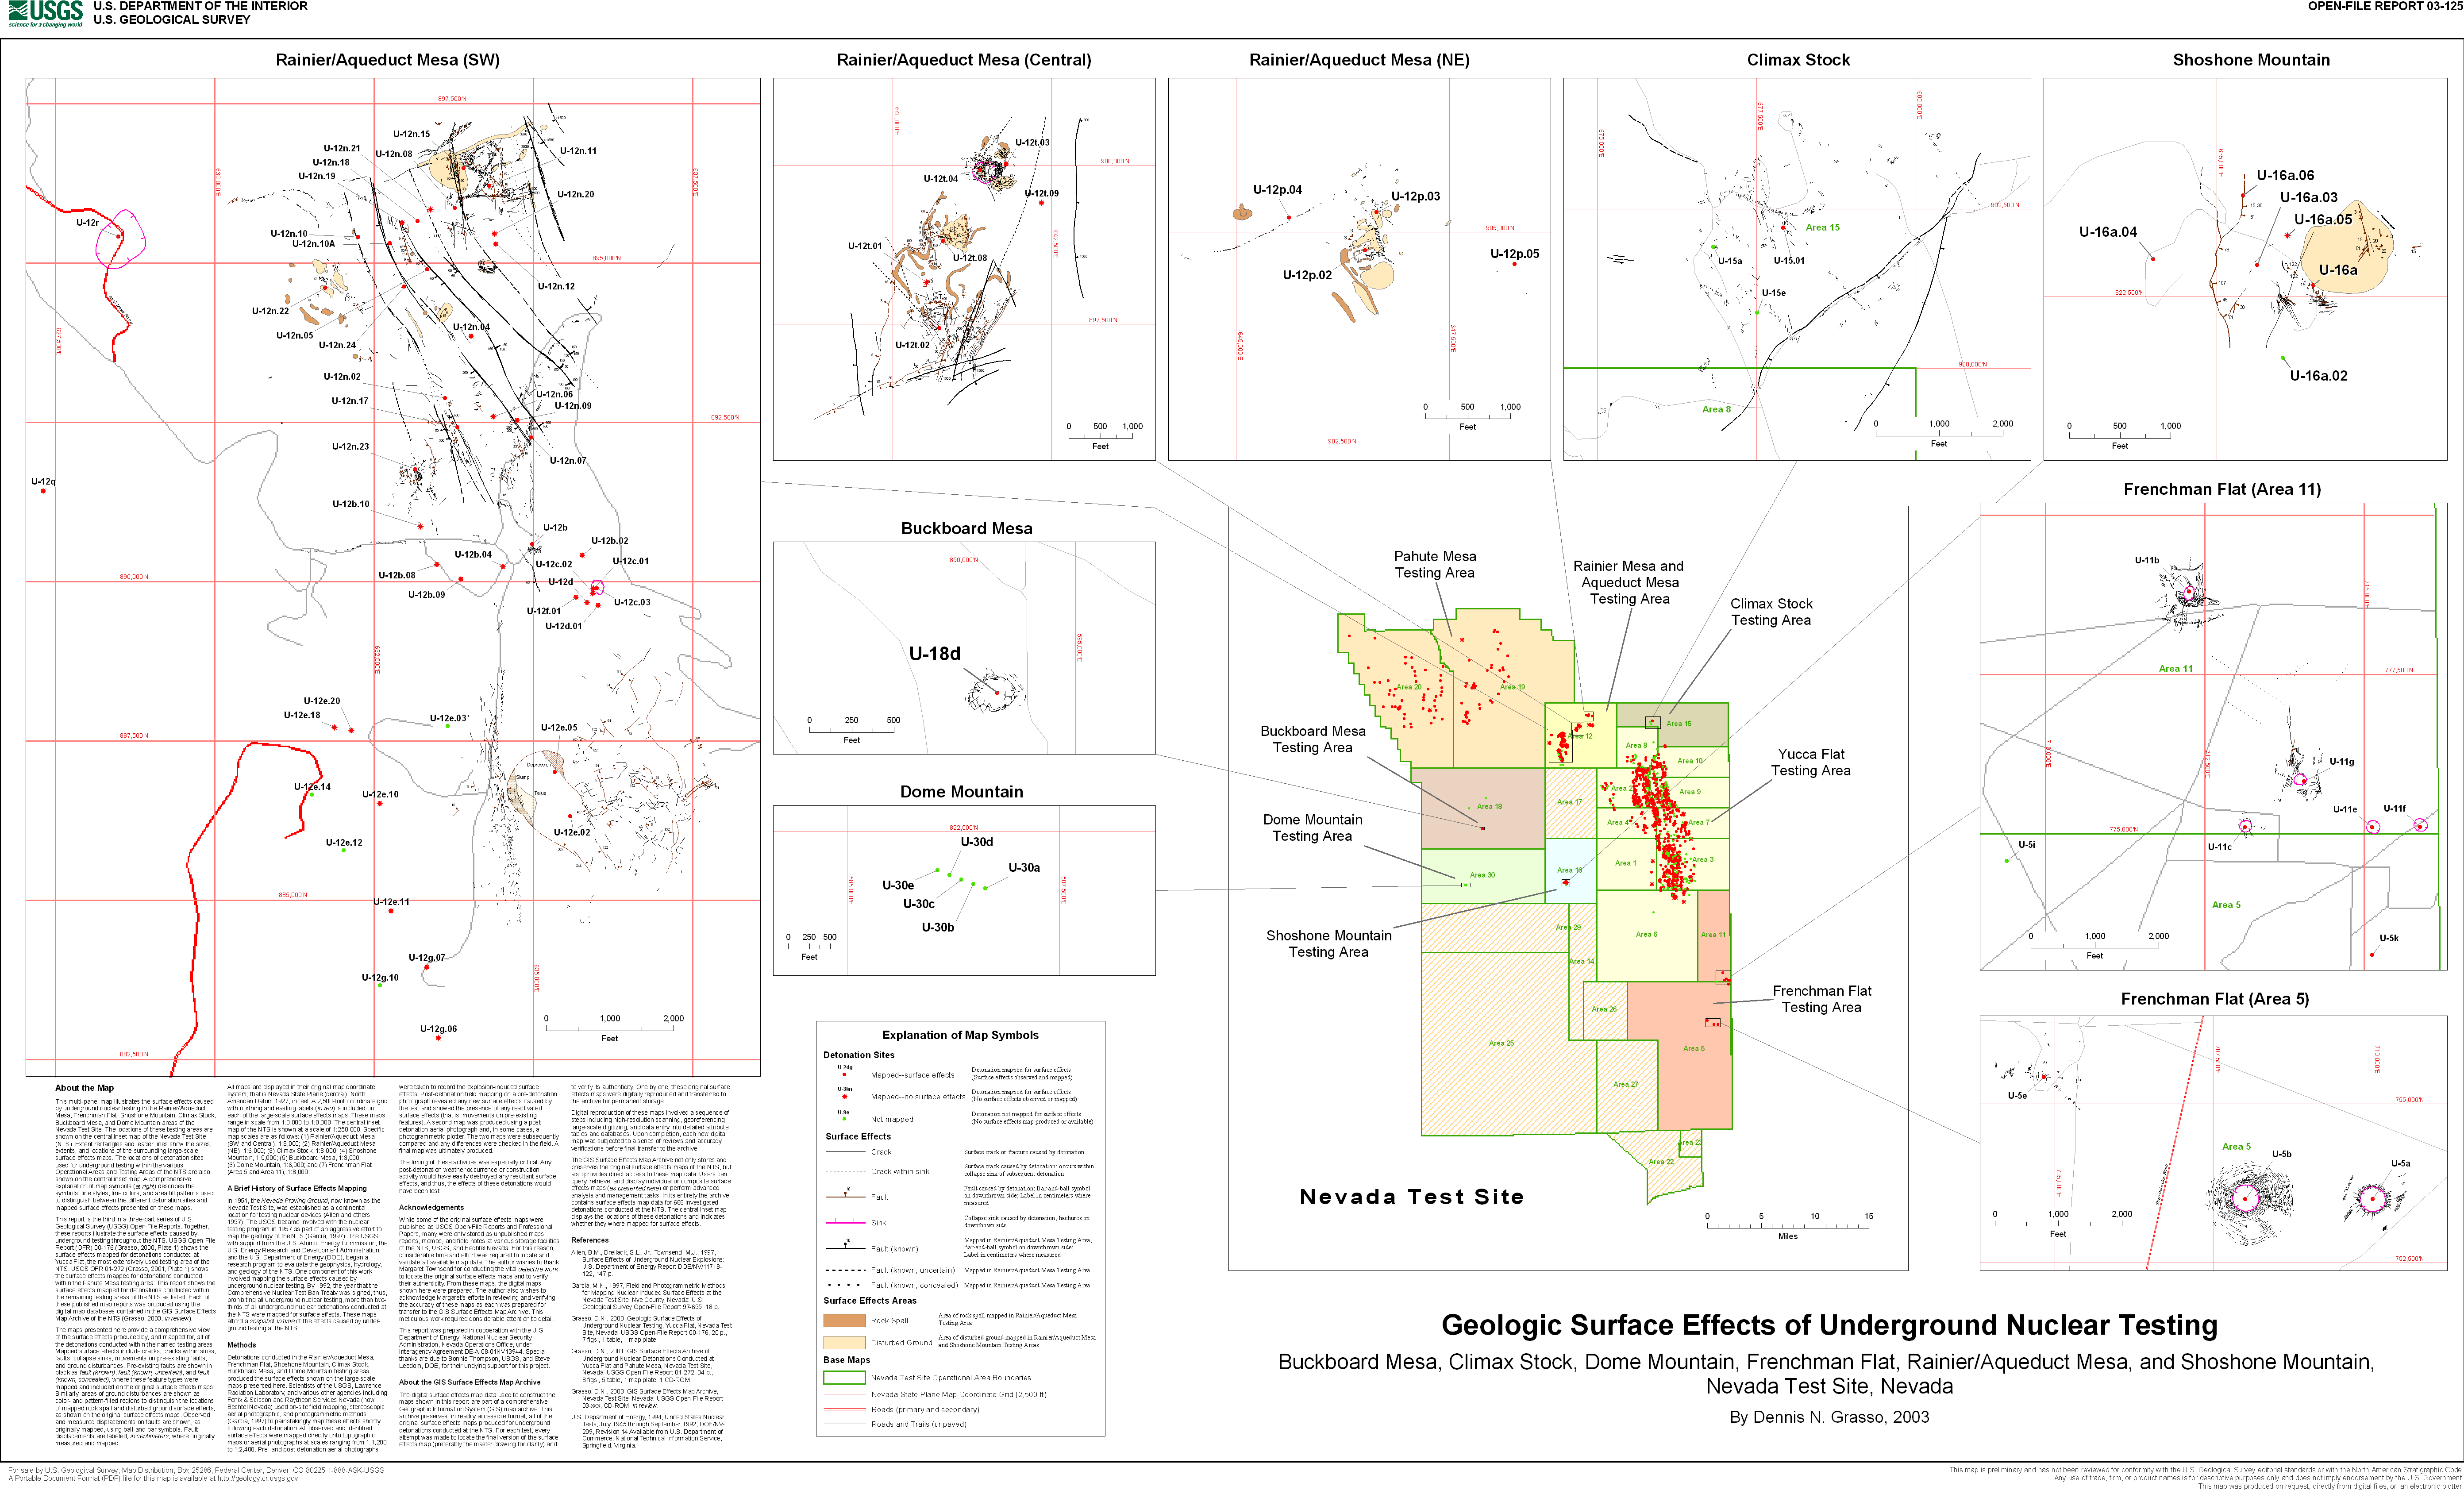
OFR 03-125 (Map): This large-scale,
multi-panel map displays the surface
effects mapped for detonations conducted within the Buckboard Mesa, Climax Stock, Dome Mountain, Frenchman Flat, Rainier/Aqueduct Mesa, and Shoshone
Mountain testing area. Surface effects include
collapse sinks, cracks, faults, and movement on known faults. Red dots and stars are
detonation mapped for surface effects. Green dots are detonations not
mapped for surface effects. The map explanation (lower center) provides a
description of all map features. The text block (lower left) provides
further information about the map.
PAN
MAP down and to right ==> |