U.S. Geological Survey Open-File Report 03-040
Figure 4B
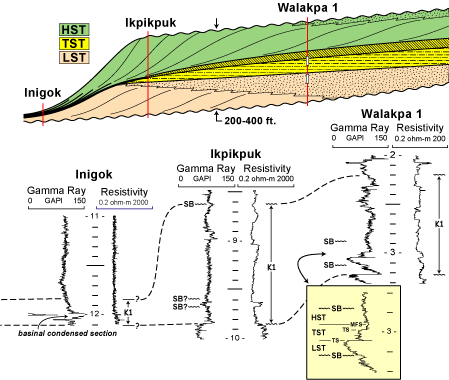
Figure 4B. Schematic illustration
of an idealized depositional sequence within K1 and wireline logs from wells
inferred to penetrate various locations within K1 sequence set.
Wireline log depth ticks are at 100 ft. intervals and numbers are 1000’s
ft. Note log response of basinal condensed section in Inigok well log.
HST, highstand systems tract; TST, transgressive systems tract; LST,
lowstand systems tract, SB, sequence boundary; SB?, candidate sequence boundary;
MFS, maximum flooding surface; TS, transgressive surface.