
U.S. Geological Survey Open-File Report OF 03-61
Gulf of Mexico Planktic Foraminifer Transfer Function GOM2: Preliminary Report
By Harry J. Dowsett [1] , Stacey Verardo, and Richard Z. Poore
INTRODUCTION AND BACKGROUND
Multivariate statistical analysis of microfossil census data from marine and terrestrial deposits has proved to be a powerful tool for paleoclimatic and paleoceanographic investigations. Despite the development of a number of proxy indicators of sea surface temperature (SST) (oxygen isotopes, Mg/Ca ratios, alkenones, etc.), the most enduring technique has been the transfer function pioneered by Imbrie and Kipp (1971). The method involves factor analysis and multiple regression to develop equations relating microfossil abundance data in modern (core-top) samples to physical parameters such as SST, salinity, dissolved oxygen content, etc. The equations can then be applied to downcore faunal census data to estimate past oceanographic conditions. The technique has been widely applied in paleoclimate studies using a variety of fossil groups from Pliocene to Holocene sediments (eg., Kipp, 1976; Sancetta, 1979; Thunell, 1979a,b; CLIMAP, 1981, 1984; Ruddiman and Esmay, 1986; Hays et al., 1989; Dowsett and Poore, 1990; Cronin and Dowsett, 1990, Dowsett et al., 1996; 1999).
The successful application of the transfer function technique, or any other method of paleontological reconstruction, depends upon two primary factors: (1) the assumption that ecological tolerances of indicator taxa do not change over time and (2) the existence of a taxonomically stable and well-dated calibration data set. The first factor must be assumed in any reconstruction and extends to isotopic and chemical proxy methods, as well as paleontologically based techniques (Dowsett and Robinson, 1998). The second factor, the modern calibration data set, is more problematic. When reconstructing mid Pliocene SST, Dowsett and Poore (1990) were able to use a calibration data set whose samples represented conditions during the last 30 ky. The middle Pliocene temperature signal was large with respect to late Pleistocene variability. In fact, the paleotemperature equations worked remarkably well on North Atlantic last glacial maximum (LGM) and last interglacial maximum (LIM) data sets (Dowsett, 1991).
When reconstructing Holocene SST exhibiting millenial and sub-millenial scale variability, the calibration data set must be isochronous. Dowsett et al. (2002) showed that in general, the last 1500 years of faunal variability in the Gulf of Mexico region is relatively constant. Our goal is to develop and document a factor analytic planktic foraminifer transfer function capable of reconstructing Holocene temperature changes in the Gulf of Mexico. We have selected a suite of accelerator mass spectrometer (AMS) 14C dated core-top samples (Dowsett et al., 2003) and factor analyzed the associated faunal assemblages. A set of equations were developed (transfer function GOM2) that relate modern physical oceanography to the faunal data. In this paper we outline the development of GOM2 and use it to delineate a record of surface temperature from piston cores in the northern and western Gulf of Mexico.
MODERN CORE-TOP DATA FROM THE GULF OF MEXICO
Core-top samples included in this report (Figure 1) were originally retrieved during Gulf of Mexico cruises of the RV Vema, RV Robert Conrad, RV Trident, RV Gyre, RV Knorr, and RV Marion-Dufresne between 1950 and 2002. Dowsett et al. (2003) did a preliminary culling of nearly 200 core-top samples with goals of (1) simplifying
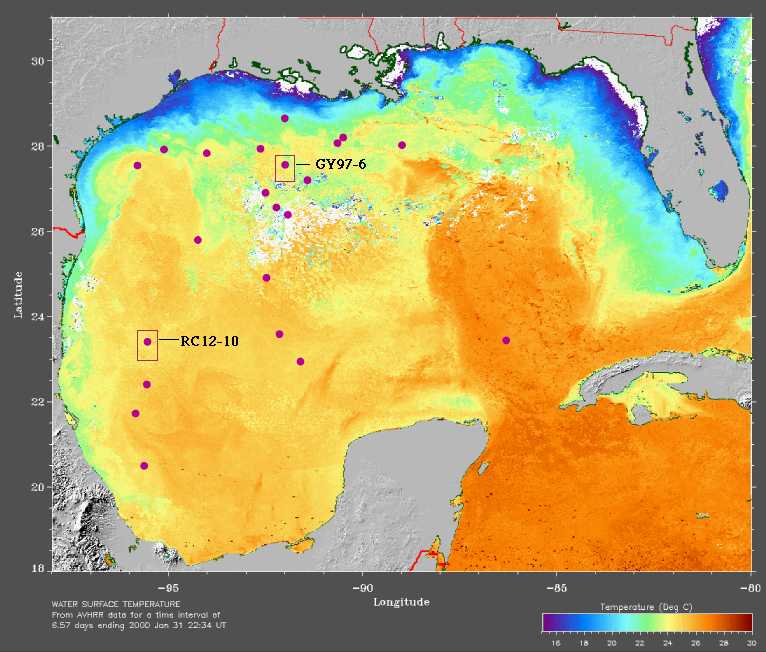
Figure 1. Distribution of Gulf of Mexico core-top samples (bullets) and location of piston cores (rectangles) used in this study displayed on January 2000 sea-surface temperature (SST) map. Advanced Very High Resolution Radiometer (AVHRR) data from a time interval of 6.57 days ending on January 31. Dark orange colors represent warmest SST (~29°C ). The shallow near-shore waters of the U.S. Gulf Coast exhibit SST near 16°C. (map provided by Space Oceanography Group, Johns Hopkins University Applied Physics Laboratory)
taxonomic differences between samples identified by various workers (Brunner and Cooley, 1976; Brunner, 1982) and (2) dating assemblages with AMS 14C techniques to make the data more attractive as a calibration for Gulf of Mexico paleoenvironmental studies. The resulting database contains 161 samples. The 22 samples used in the present study (Appendix A) provide coverage of the central and western Gulf of Mexico. Samples are derived primarily from piston or gravity cores. Core MD02-2553 is a Calypso square core. Because core-top material is limited, Dowsett et al. (2003) often obtained dates from two samples near the core-top and then extrapolated to obtain a core-top age. In some cases, dates are directly from the highest sample in the core. In one instance (RC10-263), the above methodology was employed on piston core samples, but the fauna was derived from the trigger-weight core-top. The other two trigger-weight samples (RC10-268 and TR126-23) were dated directly. All samples have calendar year dates <=1500 years BP (Figure 2). Additional information on faunal and radiocarbon sample processing techniques can be found in Dowsett and Poore (2001) and Dowsett et al. (2003).
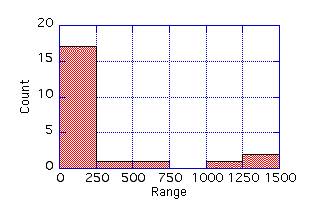
Figure 2. Distribution of sample ages for core-top samples included in study.
February and August SST were determined for each site using the Reynolds and Smith (1995) adjusted optimum SST data set. These SST values are given in Appendix A. February SST ranges from 18.99 °C to 25.13 °C while August SST has a mean value of 29.51°C and a range of only 0.63 °C. Figure 3 shows that inter-annual variability of winter and summer SST in the Gulf of Mexico is very low. Summer conditions are warm everywhere except the shallowest nearshore regions. Summer maximum SST approaches 30°C. During winter, the Loop Current is a persistent feature showing up
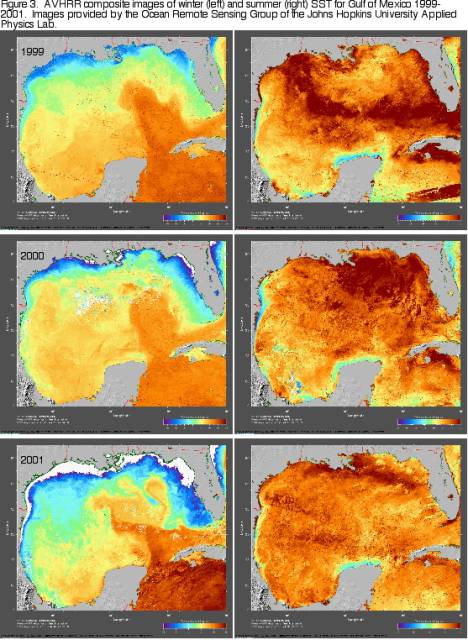
as an incursion of very warm Caribbean water advecting into the Gulf of Mexico and passing out to the Atlantic through the Florida Strait. Figure 3 further illustrates the fact that summer conditions in the Gulf of Mexico are uniformaly warm with minor geographic variability.
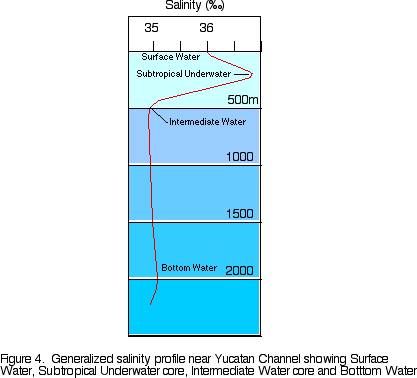
A vertical salinity profile (Figure 4) located in the path of the Loop Current in the northern Yucatan Channel identifies the water masses present in the Gulf Basin. The high salinity subtropical underwater originating in the Carribbean is overlain by lower salinity surface water of the Gulf of Mexico Basin. During the summer monsoon season, winds are out of the southeast, and precipitation increases leading to lower salinity surface water due to local precipitation increase and increased runnoff from southwestern North America. During winter, the intertropical convergence zone (ITCZ) moves south, precipitation decreases, and surface waters become more saline.
For each faunal sample, we tallied the number of individual planktic foraminifers in each of 30 counting categories according to the taxonomic concepts of Parker (1962, 1967), Blow (1969), Kipp (1976), and Kennett and Srinivasan (1983). Those categories with a maximum of one individual in 2 or less samples were deleted from the data set. The resulting 24 categories are given in Table 1.
Table 1. Taxonomic categories
| Taxon | Maximum Occurrence (% of sample) | Code |
|---|---|---|
| Orbulina universa | 8.47 | univ |
| Globigerinoides conglobatus | 3.33 | cglb |
| Globigerinoides ruber | 72.27 | rubr |
| Globigerinoides tenellus | 3.25 | tenl |
| Globigerinoides sacculifer | 28.37 | sacc |
| Sphaeroidinella dehiscens | 0.46 | dhsc |
| Globigerinella aequilateralis | 10.83 | aqui |
| Globigerinella calida | 7.38 | cald |
| Globigerina bulloides | 12.38 | bull |
| Globigerina falconensis | 8.94 | falc |
| Globigerina digitata | 1.66 | digt |
| Globigerina rubescens | 4.41 | rbsc |
| Turborotalita quinqueloba | 0.46 | quin |
| Neogloboquadrina dutertrei | 14.67 | dutr |
| Pulleniatina obliquiloculata | 19.41 | obqa |
| Globorotalia inflata | 0.71 | infl |
| Globorotalia truncatulinoides (s) | 1.27 | trcs |
| Globorotalia truncatulinoides (d) | 17.00 | trcd |
| Globorotalia crassaformis | 2.85 | crss |
| Neogloboquadrina pachyderma -- | ||
| Neogloboquadrina dutertrei (P - D ) | 0.99 | dupc |
| Globorotalia scitula | 1.93 | scit |
| Globorotalia menardii | 17.67 | mnrd |
| Candeina nitida | 1.06 | nitd |
| Globigerinita glutinata | 12.91 | glut |
Both 'pink'and 'white'varieties of Globigerinoides ruber (d'Orbigny) were combined into one counting category. Likewise, the Globigerinoides sacculifer (Brady) category contains specimens of Globigerinoides quadrilobatus (d'Orbigny) and Globigerinoides trilobus (Reuss).
The Neogloboquadrina pachyderma - Neogloboquadrina dutertrei (P - D ) intergrade category contains specimens of right-coiling Neogloboquadrina with more than four chambers in the final whorl, transitional between Neogloboquadrina pachyderma (Ehrenberg) and Neogloboquadrina dutertrei (d'Orbigny). While not a quantitatively significant taxon in the Gulf of Mexico, the category was retained to simplify comparisons with previous North Atlantic work (Imbrie and Kipp, 1971). The Globorotalia menardii (Parker, Jones, and Brady) complex includes specimens of Gl. menardii, Globorotalia tumida (Brady) s.l., and Globorotalia ungulata Bermudez.
FACTOR ANALYSIS
The 24 taxonomic categories were normalized in each of the 22 samples to give each sample equal weight. Q-mode factor analysis was used to reduce the 24 original taxonomic categories to 5 varimax factors (assemblages). Modern assemblages can then be expressed as proportions of assemblages. The contributions of each of the factors to each of the modern samples, as well as sample communalities, are given in the factor loading matrix (Table 2).
Table 2. Varimax factor loadings
| Sample | Comm. | F1 | F2 | F3 | F4 | F5 |
|---|---|---|---|---|---|---|
| 1 | .9931 | .4419 | -.5482 | .6902 | -.1195 | .0812 |
| 2 | .9906 | .4438 | -.6548 | .5650 | -.1056 | .1861 |
| 3 | .9944 | .3544 | -.3728 | .8235 | -.0691 | -.2164 |
| 4 | .9819 | .2486 | -.8460 | .4454 | .0725 | .0262 |
| 5 | .9741 | .6214 | -.5563 | .4988 | -.1325 | .1107 |
| 6 | .9949 | .5071 | -.6397 | .5235 | -.2180 | .0835 |
| 7 | .9883 | .5927 | -.5453 | .5347 | -.2285 | .0376 |
| 8 | .9775 | .4567 | -.4442 | .7062 | -.1453 | .2277 |
| 9 | .9926 | .5556 | -.6044 | .5026 | -.2534 | .0412 |
| 10 | .9958 | .5455 | -.6714 | .4606 | -.1832 | .0398 |
| 11 | .9775 | .5617 | -.6975 | .3843 | -.1601 | -.0460 |
| 12 | .9881 | .7013 | -.3378 | .6035 | -.1307 | .0291 |
| 13 | .9897 | .7323 | -.3430 | .5734 | -.0267 | .0794 |
| 14 | .9547 | .6413 | -.3933 | .6103 | -.1202 | .0430 |
| 15 | .9833 | .7287 | -.4788 | .4681 | -.0298 | -.0549 |
| 16 | .9937 | .6508 | -.6511 | .2604 | -.2786 | -.0274 |
| 17 | .9935 | .5079 | -.4556 | .7177 | -.1059 | .0401 |
| 18 | .9956 | .6564 | -.5194 | .4940 | -.2160 | .0656 |
| 19 | .9819 | .6579 | -.3532 | .5970 | -.2533 | .0623 |
| 20 | .9855 | .5565 | -.5187 | .6223 | -.0963 | .1010 |
| 21 | .9658 | .7405 | -.5024 | .3992 | .0522 | .0545 |
| 22 | .9607 | .4954 | -.4115 | .7162 | -.0352 | .1781 |
| % Variance | 33.290 | 29.240 | 32.362 | 2.469 | 1.064 | |
| % Cum. Variance | 33.290 | 62.529 | 94.891 | 97.360 | 98.424 |
The 5 factor model accounts for 98.9 % of the original Gulf of Mexico data. The first three factors are all of equal importance and account for ~95% of the cumulative variance. For this reason, only the first three factors are interpreted below but all are included for completeness. The relative importance of each of the 24 counting categories to each factor are presented in the factor score matrix (Table 3).
Table 3. Varimax assemblage description matrix
| Taxon | F1 | F2 | F3 | F4 | F5 |
|---|---|---|---|---|---|
| univ | -.0873 | -.1101 | .0845 | .0748 | .2110 |
| cglb | -.0102 | .0102 | .0837 | .0641 | -.0755 |
| rubr | .5880 | -.6535 | .2609 | -.3937 | -.0088 |
| tenl | .0570 | -.0112 | -.0356 | .0425 | -.0170 |
| sacc | -.3123 | -.5761 | .1166 | .5067 | .1218 |
| dhsc | -.0081 | -.0086 | .0062 | .0067 | -.0149 |
| aqui | .1555 | .0599 | .0738 | .2492 | .1012 |
| cald | .0765 | -.0281 | .1055 | .2564 | .0722 |
| bull | .4071 | .1635 | -.0504 | .2811 | -.1526 |
| falc | .2727 | .0191 | -.1219 | .2846 | -.0318 |
| digt | .0261 | .0011 | -.0042 | .0566 | .0304 |
| rbsc | .0131 | -.0241 | -.0218 | .0031 | -.0418 |
| quin | .0023 | -.0018 | -.0014 | .0007 | -.0014 |
| dutr | .1227 | .1786 | .3685 | .1242 | -.4438 |
| obqa | .1170 | .2040 | .3861 | .0851 | .7578 |
| infl | -.0022 | -.0101 | .0014 | .0237 | -.0029 |
| trcs | -.0046 | -.0072 | .0098 | -.0104 | -.0232 |
| trcd | .0623 | .3189 | .5694 | -.1221 | -.0377 |
| crss | .0158 | .0102 | .0320 | -.0080 | -.0733 |
| dupc | .0092 | -.0059 | -.0012 | .0379 | -.0093 |
| scit | .0023 | .0007 | .0048 | .0071 | .0206 |
| mnrd | -.3148 | -.1421 | .4955 | .1634 | -.3300 |
| nitd | -.0101 | -.0196 | -.0012 | .0198 | .0022 |
| glut | .3763 | .0148 | -.1128 | .4674 | -.0624 |
| othr | .0309 | .0156 | .0032 | .0169 | -.0068 |
Insight into the interpretation of factor 1 (F1) can be gained by looking at the factor loadings (Table 2). Most samples have fairly consistent loadings on F1 except for sample 4 (=RC10-262) located furthest east, in the path of the Loop Current, which has a low loading. This is the only site that monitors the full effect of the advection of Carribean water into the Gulf of Mexico. Caribbean surface water transports Globigerinoides sacculifer into the Gulf of Mexico, and the planktic assemblage from RC10-262 contains nearly 39% Globigerinoides sacculifer. We interpret FI to represent normal warm GOM conditions. Table 3 shows that Globigerinoides ruber, Globigerinita glutinata, and Globigerina bulloides all make significant contributions to this assemblage.
Factor 2 appears to contrast dextral coiling Globorotalia truncatulinoides and Pulleniatina obliquiloculata with Globigerinoides ruber and Globigerinoides sacculifer. This factor may represent the contrast between a shoaling or diving thermocline. When positive, F2 repesents 'normal' conditions with either Globigerinoides species in abundance. When the thermocline shoals, deeper dwelling planktics like Pulleniatina obliquiloculata and Globorotalia truncatulinoides make greater contributions to the assemblage.
Some of the heavier, deeper dwelling planktic species have significant contributions to Factor 3. Globorotalia menardii, Pulleniatina obliquiloculata, and Neogloboquadrina dutertrei and Globorotalia truncatulinoides are the most important of this group.
Factors 4 and 5 together account for a small percentage of the variance and are not interpreted.
DERIVATION OF TRANSFER FUNCTION GOM2
Transfer functions are sets of equations which relate physical oceanographic parameters to faunal data. Transfer function F13 (Kipp, 1976) contained 16 equations estimating temperature and salinity at the sea-surface and 100m depth. Transfer function GSF18 (Dowsett and Poore, 1990; Dowsett, 1991) was a set of two equations that related 5 varimax assemblages derived from a revised and simplified North Atlantic modern core-top data to winter and summer SST. Brunner (1979) developed a transfer function for the Gulf of Mexico based upon the North Atlantic core-top data from CLIMAP in combination with her own database from the Gulf of Mexico.
During the development of the present transfer function, we experimented with several different taxonomic groupings. One early experiment (hereafter called GOM1) utilized 30 counting categories and was based upon the Gulf of Mexico portion of the Brunner (1979) work. Transfer function GOM1 related 5 factors or assemblages to winter and summer SST. The primary difference between GOM1 and GOM2 lies in the age calibration of samples and number of samples used.
Transfer function GOM2, derived in this study, utilizes taxonomic categories and relates 5 varimax assemblages to winter and summer SST in the Gulf of Mexico Basin. Standard multiple regression techniques have been applied to write paleoecological equations of the form
Yest = Bct2 K + k0
where Yest = the paleoecological estimates, Bct2 = the cross product matrix formed by arranging the varimax factors, their squares and cross products into a matrix, K = a vector of regression coefficients corresponding to the columns of Bct2 , and k0 is the intercept of the equation.
Table 4. Coefficients of terms and intercept of equation GOM2, multiple correlation coefficients, and standard errors of estimate for February and August.
| SSTFEB | SSTAUG | |
|---|---|---|
| Multiple correlation coefficient (adjusted for degrees of freedom) |
0.95 | 0.87 |
| Standard error of estimate (∞C) (adjusted for degrees of freedom) |
1.76 | 0.06 |
| Factor 1 | -16.47 | -6.32 |
| Factor 2 | 3.12 | 7.32 |
| Factor 3 | -1.09 | -7.79 |
| Factor 4 | -10.26 | 0.81 |
| Factor 5 | -1.11 | 2.30 |
| Factor 1 x Factor 2 | -7.93 | -3.89 |
| Factor 1 x Factor 3 | 6.37 | 4.22 |
| Factor 1 x Factor 4 | 7.52 | -0.47 |
| Factor 1 x Factor 5 | 1.06 | -1.28 |
| Factor 2 x Factor 3 | 1.32 | -5.01 |
| Factor 2 x Factor 4 | -5.63 | 0.56 |
| Factor 2 x Factor 5 | -1.60 | 1.32 |
| Factor 3 x Factor 4 | 3.82 | -0.56 |
| Factor 3 x Factor 5 | 1.13 | -1.56 |
| Factor 4 x Factor 5 | 6.26 | 0.66 |
| Factor 1 squared | 8.61 | 1.66 |
| Factor 2 squared | 0.27 | 2.17 |
| Factor 3 squared | -1.02 | 2.46 |
| Factor 4 squared | -1.06 | -0.17 |
| Factor 5 squared | -1.38 | 0.33 |
| Intercept | 5.18 | 6.21 |
The statistics of GOM2 are given in Table 4. The multiple correlation coefficients for February and August SST are .95 and .87 respectively. Analysis of the residuals (measured as observed SST minus estimated SST) shows that they are generally randomly distributed with respect to observed temperature (Figure 5). The standard error of estimate for February temperatures (1.76 °C) is higher and for summer temperatures (0.06 °C) is lower than the standard errors associated with GSF18 or F13 (Dowsett, 1991). The small range of August SST in the calibration data set makes GOM2 unreliable for down-core August SST reconstruction.
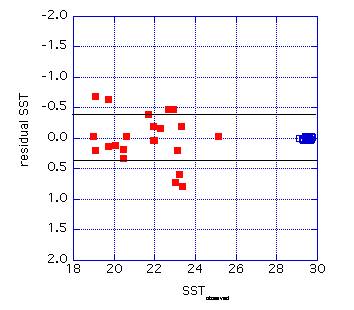
Figure 5. Plot of residuals (observed minus estimated) for winter (red) and summer (blue) season from equation GOM2. Horizontal lines represent ±1s for February.
PISTON CORES RC12-10 AND GYRE97-6PC20
Faunal assemblages from two piston cores in the northern and westen Gulf of Mexico were selected to test GOM2 (Figure 1). Faunal data from both cores are found in Appendix B. Stable isotope data from RC12-10 are in Appendix C. Sampling, processing, and dating of these sequences are discussed in Poore et al. (in press).
Overall, the application of GOM2 to both cores was succesful (Table 5). Tranformation of the faunal data into factors determined from the core-top factor analysis (Bct) was accomplished by post-multiplication of the row normalized percent faunal data (U) by the factor description matrix (F). The coefficients from the regression analysis (Table 4) were then applied to the estimated factors to produce SST estimates for both February and August for each core (Appendix C.) Communality estimates suggest that the core-top factor model does an adequate job of accounting for the variability found in the down-core assemblages.
Table 5. Transfer function GOM2 performance
| RC1210 | ----------------------- | February ->August |
|---|---|---|
| Minimum | 16.0 -> 27.7 | |
| Maximum | 25.5 -> 29.7 | |
| Range | 9.4 -> 2.0 | |
| Mean | 22.6 -> 29.2 | |
| GYRE97-6, PC20 | ----------------------- | February -> August |
| Minimum | 20.4 -> 28.6 | |
| Maximum | 25.6 -> 29.7 | |
| Range | 5.2 -> 1.2 | |
| Mean | 22.9 -> 29.4 |
As expected, August SST estimates have a smaller standard deviation than the February estimates due to the small range in the August calibration data. February temperature at RC12-10 ranged between 16°C and 25°C with a mean of 22.6°C. August temperature ranged from 27.7°C to 29.7°C with a mean of 29.2°C. February temperature for the GYRE97-6, PC20 core ranged from 20.4°C to 25.6°C with a mean of 22.9°C. August temperature ranged from 28.6°C to 29.7°C with a mean of 29.4°C. In those GYRE97-6, PC20 samples where February temperature ranged higher than the calibration data, there was a definite decrease in communality, suggesting a less than ideal fit between the downcore assemblages and the core-top factor model (see discussion).
DISCUSSION
Development of GOM2 went through a number of phases with various core-top sample groupings and taxonomic schemes. All previous attempts at creating a transfer function for the Gulf of Mexico involved using core-top data that was not well dated. Inclusion of these data in the factor analysis led to greater faunal variability at any one geographic location (due to mixing of Holocene and glacial age faunas). Greater core-top variability led to a noiser factor solution and less than desirable correlation of those factors to modern oceanographic data. However, these experimental solutions were robust in that they could account for down-core variability. Thus, SST estimates were obtained that appeared realistic yet were not accurate.
GOM2 has a better correlation coefficient than the earlier attempts. However, the regression is very sensitive to small faunal changes outside the variability encountered in the core-top calibration data. Further work needs to be done to make GOM2 more robust.
CONCLUSION
This preliminary analysis of equation GOM2 is encouraging. The single biggest strength of GOM2 is that the calibration data have been dated using AMS 14C, thereby removing a major pitfall associated with previous planktic foraminifer transfer functions. The number of samples in the calibration data set is small and should be increased. Inclusion of well dated samples from outside the Gulf of Mexico should increase the performance of GOM2. The low variability in inter-anual summer temperatures makes GOM2 highly sensitive and not useful for estimating August SST. Using the transfer function as a semiquantitative indicator of warming and cooling is more appropriate. Further analysis of the assemblages that lead to low communality estimates should provide insight into creating a more robust method for estimating Gulf of Mexico SST.
ACKNOWLEDGEMENTS
We thank Lisa Osterman and Laurel Bybell for reviews which greatly improved the clarity of this work. Bethany Boisvert, Kate Pavich, and Jessica Darling helped with sample procurement and processing. Charlotte Brunner graciously provided access to all her data and discussed sample processing and analysis. This work would not have been possible without her cooperation and insight. Rusty Lotti of Lamont Doherty Earth Observatory (LDEO) aided sampling of RC12-10 and other core-top samples. The LDEO core lab is funded under NSF Grant OCE97-11316 and Office of Naval Research Grant N00014-96-10186. This work was supported by the USGS Earth Surface Dynamics Program.
REFERENCES
Blow, W.H., 1969. Late middle Eocene to Recent planktonic foraminiferal biostratigraphy. In: Bronnimann, P. and Renz, H.H., (Eds.), Proceedings of the First Planktonic Conference: Leiden (E.J. Brill), p. 199-422.
Brunner, C.A., 1979. Distribution of planktonic foraminifera in surface sediments of the Gulf of Mexico. Micropaleontology, 25(3): 325-335.
Brunner, C.A., 1982. Paleoceanography of surface waters in the Gulf of Mexico during the Late Quaternary. Quaternary Research, 17: 105-119.
Brunner, C.A. and Cooley, J.F., 1976. Circulation in the Gulf of Mexico during the last glacial maximum. Geological Society of America, Bulletin, 87: 681-686.
CLIMAP, 1981. Seasonal reconstructions of the Earths surface at the last glacial maximum. In: McIntyre, A., Map and Chart Series 36, Geological Society of America.
CLIMAP, 1984. The last interglacial ocean. Quaternary Research, 21: 123-224.
Cronin, T.M. and Dowsett, H.J., 1990. A quantitative micropaleontologic method for shallow marine paleoclimatology: Application to Pliocene deposits of the western North Atlantic Ocean. Marine Micropaleontology 16(1/2): 117-148.
Dowsett, H.J., 1991. The development of a long-range foraminifer transfer function and application to Late Pleistocene North Atlantic climatic extremes. Paleoceanography, 6: 259-273.
Dowsett, H., Barron, J., and Poore, R., 1996. Middle Pliocene sea surface temperatures: a global reconstruction. Marine Micropaleontology, 27:13-26
Dowsett, H.J., Barron, J.A., Poore, R.Z., Thompson, R.S., Cronin, T.M., Ishman, S.E., and Willard, D.A., 1999. Middle Pliocene paleoenvironmental reconstruction: PRISM2. USGS Open File Report 99-535, http://pubs.usgs.gov/openfile/of99-535/.
Dowsett, H.J., Brunner, C.A., Poore, R.Z. and Boisvert, B.A., 2002. Gulf of Mexico planktic foraminifer core-top data. EOS Transactions AGU, 83(19), Spring Meeting Supplement, Abstract GS41A-09.
Dowsett, H.J., Brunner, C.A., Verardo, S., and Poore, R.Z., 2003. Gulf of Mexico planktic foraminifer core-top calibration data set: Raw data. USGS Open File Report 03-008.
Dowsett, H.J. and Poore, R.Z., 1990. A new planktic foraminifer transfer function for estimating Pliocene through Holocene Sea Surface temperatures. Marine Micropaleontology 16(1/2): 1-23.
Dowsett, H.J. and Poore, R.Z., 2001. Planktic foraminifer census data from the northwestern Gulf of Mexico. U.S. Geological Survey Open File Report 01-108: 1-6.
Dowsett, H. and Robinson, M., 1998. Application of the modern analog technique (MAT) of sea surface temperature estimation to middle Pliocene North Pacific planktic foraminifer assemblages. Paleontologia Electronica, 1(1). http://www-odp.tamu.edu/paleo/1998_1/dowsett/issue1.htm
Hays, P.E., Pisias, N.G. and Roelofs, A.K., 1989. Paleoceanography of the eastern equatorial Pacific during the Pliocene: A high resolution study. Paleoceanography 4: 57-73.
Imbrie, J. and Kipp, N.G., 1971. A new micropaleontological method for quantitative paleoclimatology: Application to a late Pleistocene Caribbean core. In: Turekian, K.K. (ed.), The Late Cenozoic Glacial Ages. New Haven, Yale University Press: 72-181.
Kennett, J.P. and Srinivasan, S., 1983. Neogene planktonic foraminifera: a phylogenetic atlas. Hutchinson Ross, New York, 265p.
Kipp , N.G., 1976. New transfer function for estimating past sea-surface conditions from sea-bed distribution of planktonic foraminiferal assemblages in the North Atlantic, In: Cline, R.M. and Hays, J.D. (eds.) Investigations of Late Quaternary paleoceanography and paleoclimatology. Mem. Geol. Soc. Am. 145, 3-41.
Murray, J., 1995. Microfossil indicators of ocean water masses, circulation and climate, In, Bosence, D. and Allison, P. (eds.), Marine palaeoenvironmental analysis from fossils, Geological Society Special Publication 83: 245-264.
Parker, F.L., 1962. Planktonic foraminiferal species in Pacific sediments. Micropaleontology, 8: 219-254.
Parker, F.L., 1967. Late Tertiary biostratigraphy (Planktonic Foraminifera) of tropical Indo-Pacific deep-sea cores: Bulletins of American Paleontology, 8: 115-208.
Poore, R.Z., Dowsett, H.J.,Verardo, S., and Quinn, T.M., in review. Millenial to century scale variability in Gulf of Mexico Holocene climate records. Paleoceanography.
Reynolds, R.W. and Smith, T.M., 1995. A high resolution global sea surface temperature climatology. Journal of Climatology, 8: 1571-1583.
Ruddiman, W.F. and Esmay, A., 1986. A stremlined foraminiferal transfer function for the subpolar North Atlantic. Initial Reports of the Deep Sea Drilling Project, 94: 1045-1057.
Sancetta, C., 1979. Oceanography of the North Pacific during the last 18,000 years, evidence from fossil diatoms. Marine Micropaleontology, 4: 103-123.
Thunell, R.C., 1979a. Climatic evolution of the Mediterranean Sea during the last 5.0 million years. Sedimentary Geology 23: 67-79.
Thunell, R.C., 1979b. Pliocene-Pleistocene paleotemperature and paleosalinity history of the Mediterranean Sea: Results from DSDP Sites 125 and 132. Marine Micropaleontology 4: 173-187.
[1] U.S. Geological Survey, 926A National Center, Reston, Virginia, 20192