
U.S. Geological Survey
Open-File Report 03-075
Online Only
Version 1.0
By Calix Saul Laboy Feliciano and Elizabeth González
|
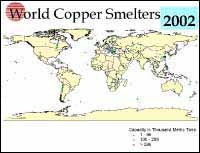
Introduction This map and table present information on 124 world copper smelters (2 of which are closed and 1 of which is under development) and 4 low-grade solvent extraction-electrowinning operations whose product requires further processing to produce refined copper. The map shows the locations of facilities and a color code based on the capacity of the facilities. Facilities with capacities of 1 to 99,000 metric tons (t) are shown in blue, facilities with capacities of 100,000 to 299,000 t are shown in green, and facilities with capacities greater than 299,000 t are shown in red. The table presents the location by the name and the latitude and longitude of the facilities, the majority owner or operating company, the status of operation as of 2002, the capacity in thousand metric tons of copper product, and the type of process used by copper smelters and solvent extraction-electrowinning facilities. These data have been compiled from multiple sources, including publications and data supplied by the International Copper Study Group and the International Wrought Copper Council as well as statistical publications of individual countries, annual reports and press releases of companies, trade journals, data gathered by USGS specialists during site visits, and estimates based upon production and other pertinent information. Multiple sources of information were used for the majority of these data. In recent years, there has been increased interest in studies that track the flow of mineral commodities through economies and that estimate residuals that are released to the environment as the result of mineral production and use. The production of copper results in the co-production of significant amounts of residuals including sulfur dioxide, arsenic, and slag. The data presented in this report can be used with data on annual copper production and on the environmental releases that characterize particular types of processes to estimate environmental residuals from copper production. |
View this image in a new window as a JPEG or view it as a PDF file [375 KB]
Download the compressed ArcView Project files ("smelters2002.apr" and "smelters.dbf".)
The spreadsheet for Open-File Report 03-075 is presented in Microsoft Excel, HTML, and tab-delimited text formats:
Download free Acrobat Reader software.
Visit the Adobe accessibility website.
Disclaimer
This report is preliminary and has not been reviewed for conformity to U.S. Geological Survey editorial standards and stratigraphic nomenclature. Any use of trade, product, or firm names in this publication is for descriptive purposes only and does not imply endorsement by the U.S. Government.
Contact Information
For questions about the scientific content of this report, contact Ivette Torres.
[an error occurred while processing this directive]