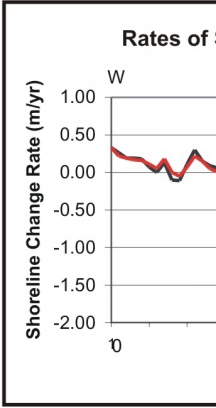
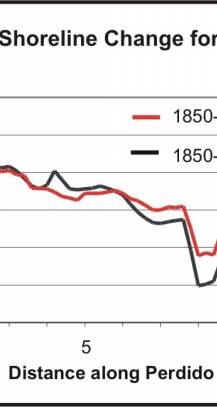
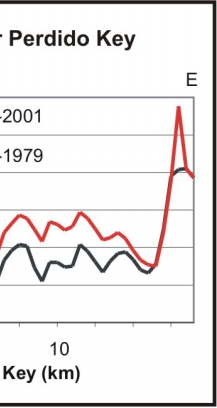
Skip past header information USGS Logo with link to USGS web page
Coastal Vulnerability Assessment of GUIS, USGS Open-File Report 03-108


Figure 11.

4.1 million cubic meters of nourishment sand were placed on Perdido Key in 1989 which influenced the rate of shoreline erosion. Prior to 1989 (black line) the calculated rate of erosion on the eastern end of Perdido Key was ~0.5 m/yr greater than after 1989 (red line).


Figure 11. Four million cubic yards of renourishment sand were placed on Perdido Key in 1989, which inflenced the rate of shoreline erosion. Figure 11. Four million cubic yards of renourishment sand were placed on Perdido Key in 1989, which inflenced the rate of shoreline erosion. Figure 11. Four million cubic yards of renourishment sand were placed on Perdido Key in 1989, which inflenced the rate of shoreline erosion.

Skip Footer Information
Department of Interior
 /  U.S. Geological Survey  /  Coastal and Marine Geology / 

USGS Privacy Statement  /  Disclaimer  /  Accessibility
This is http://pubs.usgs.gov/pubs/of/2003/of03-108/html/fig11.html
Maintained by Eastern Publications Group
Modified Saturday, 12-Jan-2013 23:45:00 EST