Skip past header information USGS Logo with link to USGS web page
Coastal Vulnerability Assessment of GUIS, USGS Open-File Report 03-108


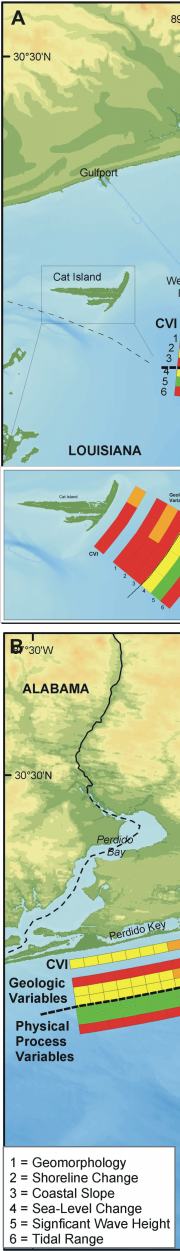
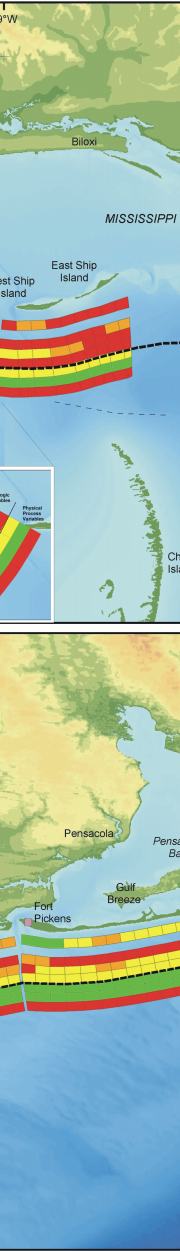
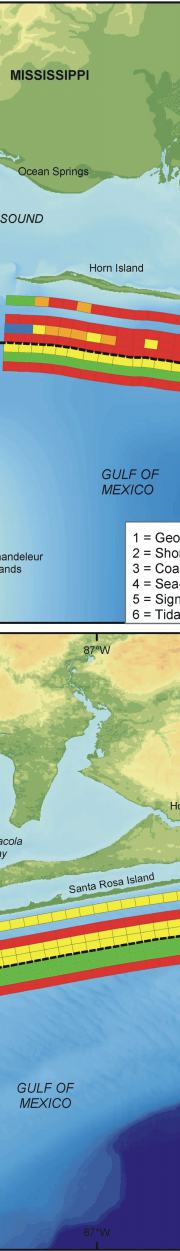
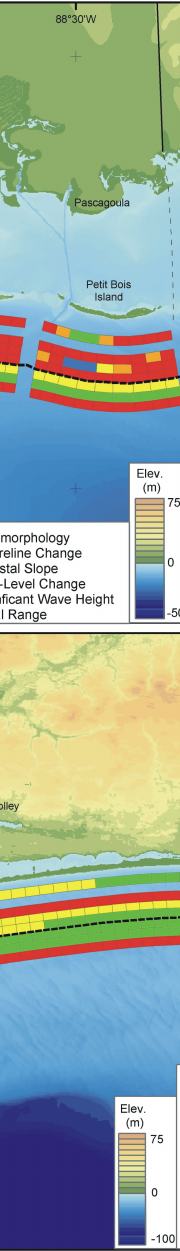
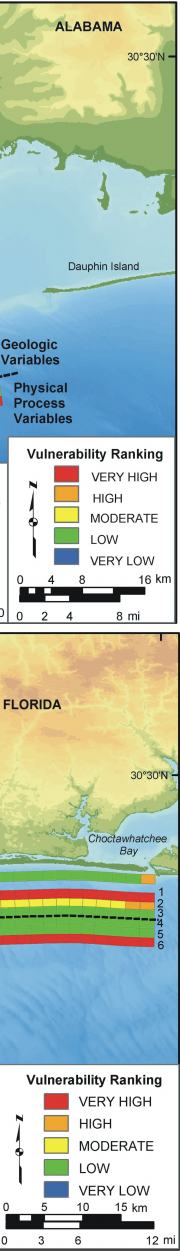
Figure 9. Relative Coastal Vulnerability for Gulf Islands National Seashore A) in Mississippi and B) in Florida. The innermost color bar is the relative coastal vulnerability index (CVI). The remaining color bars are separated into the geologic variables (1-3) and physical process variables (4 - 6). The very high vulnerability shoreline is generally along the eastern Mississippi islands. High vulnerability shoreline is concentrated around areas with a shoreline change rate between +/- 1-meter. Moderate vulnerability shoreline is primarily on Perdido Key and Santa Rosa Island, and the low vulnerability portion of the shore lies along the eastern end of Santa Rosa Island.


Figure 9:  Relative Coastal Vulnerability for Gulf Islands National Seashore A) in Mississippi and B) in Florida. Figure 9:  Relative Coastal Vulnerability for Gulf Islands National Seashore A) in Mississippi and B) in Florida. Figure 9:  Relative Coastal Vulnerability for Gulf Islands National Seashore A) in Mississippi and B) in Florida. Figure 9:  Relative Coastal Vulnerability for Gulf Islands National Seashore A) in Mississippi and B) in Florida. Figure 9:  Relative Coastal Vulnerability for Gulf Islands National Seashore A) in Mississippi and B) in Florida.

Skip Footer Information
Department of Interior
 /  U.S. Geological Survey  /  Coastal and Marine Geology / 

USGS Privacy Statement  /  Disclaimer  /  Accessibility
This is http://pubs.usgs.gov/pubs/of/2003/of03-108/html/fig9.html
Maintained by Eastern Publications Group
Modified Saturday, 12-Jan-2013 23:45:06 EST