Contaminated Sediments Database for Long Island Sound and the New York Bight, USGS Open-File Report 03-241
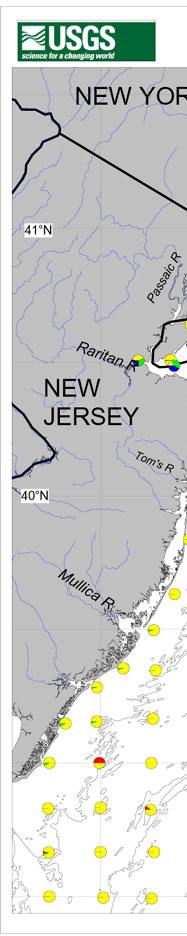
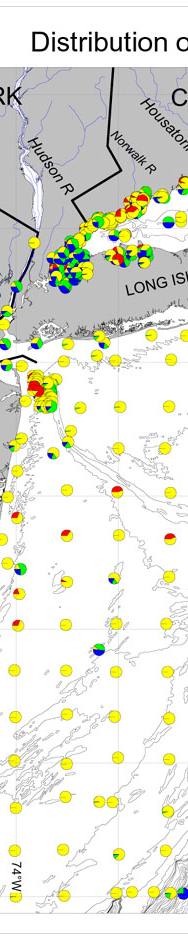
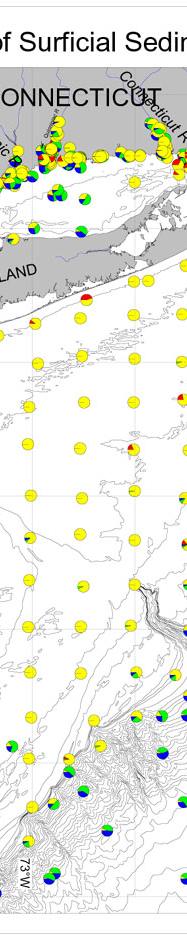
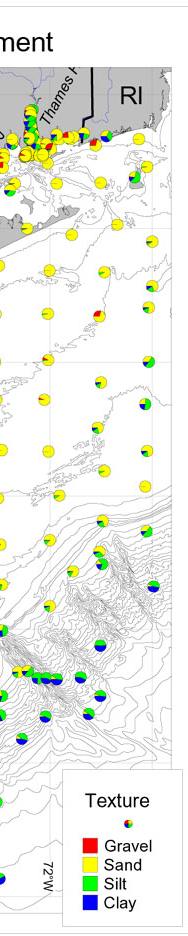
Figure shows the distribution of gravel, sand, silt and clay in pie chart format. Red represents gravel, yellow is sand, green for silt and blue for the clay fraction.
 |
 |
 |
 |
