U.S. Geological Survey
Open-File Report 03-382
Online Only
Version 1.0
Some Implications of Changing Patterns of Mineral Consumption
By W. David Menzie, John H. DeYoung, Jr., and Walter G. Steblez
U.S. Geological Survey, Reston, Virginia 20192
|
Summary This open-file report was originally presented as part of the World Mining Policies session at World Mining Congress XVIII at MINExpo INTERNATIONAL 2000®, Las Vegas, NV, October 9-12, 2000. The paper presents information on the consumption of aluminum, cement, copper, and salt in the 20 most populous countries for 1970, 1975, 1980, 1985, 1990, and 1995. |
Disclaimer
This publication was prepared by an agency of the United States Government. Neither the United States Government nor any agency thereof, nor any of their employees, makes any warranty, expressed or implied, or assumes any legal liability or responsibility for the accuracy, completeness, or usefulness of any information, apparatus, product, or process disclosed in this report, or represents that its use would not infringe privately owned rights. Reference therein to any specific commercial product, process, or service by trade name, trademark, manufacturer, or otherwise does not constitute or imply its endorsement, recommendation, or favoring by the United States Government or any agency thereof. Although data from this publication have been used by the U.S. Geological Survey, no warranty, expressed or implied, is made by the U.S. Geological Survey as to the accuracy of the data. The act of distribution shall not constitute any such warranty, and no responsibility is assumed by the U.S. Geological Survey in the use of these data.
Foreword
This paper was originally presented as part of the World Mining Policies session at World Mining Congress XVIII at MINExpo International 2000, LasVegas, NV, October 9-12, 2000. The paper was initially available online at URL http://208223.210.187/papers;menzie.pdf . That Web site is no longer available. The version of the paper presented here has been slightly modified as follows. The original text included a reference to a written communication from van Oss and Padovani; this reference has been replaced with reference to van Oss and Padovani (2003). In addition, Tables 2 and 3 have been augmented to include data for the year 2000.
Abstract
DeYoung and Menzie (1999) examined the relations among population, Gross Domestic Product, and mineral consumption (aluminum, cement, copper, and salt) for Japan, Korea, and the United States between 1965 and 1995. They noted the extremely rapid growth of consumption in Korea between 1975 and 1995. Concomitantly, Korea's population growth rate declined.
This paper extends that earlier work by examining patterns of consumption of these same commodities in the twenty most populous countries for the period 1970 through 1995. Developed countries, such as France, Germany, Japan, the United Kingdom, and the United States, show patterns of consumption that are stable (cement, copper, and salt) or grow slowly (aluminum). Some developing countries, including China, Thailand, and Turkey, show more rapid growth of consumption, especially of cement, copper, and aluminum. These changing patterns of mineral consumption in developing countries have important implications -- if they continue, there could be major increases in world mineral consumption and major increases in environmental residuals from mineral production and use. If China reaches the level of consumption of copper of developed countries, world consumption could reach levels more than twice that of 1995 (10.5 million tons).
Introduction
An intense debate in the United States about the adequacy of mineral resources to meet future societal needs was highlighted in 1972 by the publication of the book, The Limits to Growth (Meadows and others, 1972), together with the peaking of domestic oil production and the first Arab Oil Embargo. Fundamental misunderstandings of the nature of mineral reserves, mineral resources, and the mineral exploration process led the authors of that book to underestimate existing stocks of minerals and to fail to allow for replenishment of those stocks by exploration. As a result, the computer model that was the foundation for The Limits to Growth predicted the demise of industrial civilization because of a shortage of resources. When the deficiencies of the computer model became apparent, society turned its attention to more pressing problems.
However, a second concern raised by The Limits to Growth model, that increased pollution from industrial activities would overwhelm natural systems had more lasting effect. Growing awareness of the effect of human activities upon the natural environment, together with forecasts that human population would reach 10 billion by 2050, continued to hold the attention of many citizens around the world. Such concerns led the Brundtland Commission (U.N. World Commission on Environment and Development, 1987) to enunciate a goal that future development be sustainable, that is, that it meet the needs of the present generation without compromising the ability of future generations to meet their needs.
The concept of sustainable development of nonrenewable mineral resources seemed to many earth scientists to involve incompatible concepts. Debate over what constitutes sustainable development of nonrenewable resources has been vigorous. The current paper does not attempt to provide a definition of sustainable development as it relates to nonrenewable resources, but rather reviews and extends earlier work (DeYoung and Menzie, 1999) which examined the relationships among population, Gross Domestic Product, and mineral consumption. The level and growth of future mineral consumption will be a key factor in sustainability as it relates to nonrenewable resources.
Review of Previous Investigations
Wellmer and Kursten (1992), among many others, noted that more developed, industrialized countries, that represent less than 25 percent of the global population, have consumed most of the worlds marketed minerals. Less developed countries, however, have significantly higher birth rates than more developed countries. DeYoung and Menzie (1999) plotted the relation of purchasing power adjusted Gross Domestic Product and population growth rate for the 30 most populous countries in the world (figure 1). Eleven of the 30 countries had population growth rates of less than one percent. In seven of these 11 countries (France, Germany, Italy, Japan, Spain, the United Kingdom, and the United States), per capita GDP exceeded $10,000. Four countries (China, Poland, Russia, and Ukraine) with population growth rates of less than one percent have per capita GDPs that are less than $6,000. Three of these countries have recently undergone rapid and difficult economic transitions from state-controlled to market economies. The fourth country strongly discourages multi-child families. This to two questions - whether the key to reducing the rate of population growth in less developed countries lies in raising their levels of resource use, and whether per capita consumption of resources will stabilize as countries reach higher levels of economic development.
To explore these questions, a time series of population, and per capita consumption of four mineral products for three countries -- the United States, Japan, and Korea was examined. The three countries were chosen to cover a mature industrial economy, a country that recently reached industrial maturity, and a country that has been undergoing rapid industrialization. Because the goal of the study was to identify major trends in mineral consumption, the time series values of each variable were chosen for years ending in 0 or 5 for the period 1965 to 1995. The mineral products they examined were aluminum, cement, copper, and salt. These commodities were chosen to represent a variety of mineral uses and suitabilities for reuse. Aluminum is used as a structural material in building and transportation and is also used in packaging. It has replaced other materials, particularly steel, in many packaging and transportation uses. In addition, it is extensively recycled -- about 40 percent of apparent supply in the United States is from secondary aluminum. Cement -- here hydraulic cements -- is used in construction of buildings, roads, and cement products such as block, pipe, and precast aggregates, especially crushed stone. Copper consumption is often used as a measure of industrial development. Major copper uses in the United States are building construction, electrical products, and industrial machinery and equipment. Copper is extensively recycled (about 35% of apparent supply is from secondary copper). Salt is an industrial mineral with dissipative uses in industrial chemicals (sodium- and chlorine-based) and highway deicing. It cannot be recycled.
Consumption of materials can be measured at a number of points in the production process including at extraction, at beneficiation, at production of a refined product, at the point of processing to basic shapes (semi-manufacture), at manufacture of final goods, or at the point of sale to consumers. The most common point of measurement is at the point of production of refined product. When measured at this point consumption is referred to industrial consumption or apparent consumption. Industrial consumption measures the material consumed (or produced) by a country's industrial sector. If a country either exports or imports large amounts of final goods, industrial consumption may differ from final consumption by consumers.
This paper examines, as did the earlier work, industrial consumption as opposed to final or consumer consumption. Apparent consumption is calculated as total production (primary and secondary) plus imports minus exports adjusted for changes in stocks. They assumed changes in stock were zero. Figure 2 shows the individual series used to calculate aluminum consumption in the United States. Per capita consumption was calculated using population estimates for the appropriate year and country.
Figure 3 is a plot of aluminum consumption per capita in the three countries. All three countries show a continuing increase in per capita consumption of aluminum with Korea and Japan increasing their consumption faster than the United States during the period. In 1965, consumption of aluminum in the United States was about 3.36 million tons or 17 kilograms per person. By 1995, aluminum consumption in the United States had increased 134 % to 7.85 million tons. Per capita consumption had increased 72% to 30 kilograms per person. During the same period, Japanese consumption increased from just over 280,000 tons, or about 2.8 kilograms per person, to 3.88 million tons, or about 31 kilograms per person. In 1965, Korea consumed from just over 7,000 tons of aluminum, or about 0.3 kilograms per person. In 1995, Korea consumed 835,000 tons of aluminum or 18.5 kilograms per person.
Figure 4 is a plot of hydraulic cement consumption per capita in the three countries. Per capita consumption of cement in the United States has been relatively constant, fluctuating about 340 kilograms per person from 1965 to 1995. Consumption of cement in the United States increased from 64.7 million tons to 91 million tons. During the period, Japanese cement consumption increased from 31.1 million tons to 77.3 million tons, or from 314 kilograms per person to 618 kilograms per person. Korea's cement consumption grew even faster, increasing from 1.6 million tons, or 62 kilograms per person, in 1965 to 53.7 million tons, or 1.2 tons per person, in 1995.
Figure 5 is a plot of refined copper consumption per capita in the three countries. Per capita consumption of copper in the United States was 10 kilograms per person 1965 and was at the same level in 1995. Consumption of copper in the United States was 1.86 million tons in 1965, and 2.54 million tons in 1995. In Japan, copper consumption rose from 603,000 tons in 1965 to 1.44 million tons in 1995. Per capita consumption of increased from 6 kilograms per person to 11 kilograms per person. Copper consumption in Korea in 1965 was less than 1000 tons. By 1995, Korea's consumption of copper had reached 637,000 tons, or more than 14 kilograms per person.
Figure 6 is a plot of salt consumption per capita. Consumption of salt in the United States grew from 33 million tons in 1965 to 48.5 million tons in 1995. Per capita consumption was 170 kilograms in 1965 and 185 kilograms in 1995. Consumption of salt in Japan grew from 4.39 million tons or 44 kilograms per capita, in 1965 to 8.06 million tons, or 76 kilograms per capita in 1995. Salt consumption in Korea grew from 669,000 tons, or 27 kilograms per person, in 1965 to 2.4 million tons or 53 kilograms per person in 1995.
Several observations were based upon figures 3, 4, 5, and 6 (DeYoung and Menzie, 1999). Firstly, they noted that temporal patterns of commodity use per person vary by commodity for each country. No single pattern of behavior is evident in all cases. For the United States, commodity use per capita has been stable for cement, copper, and salt. The pattern of use of these commodities would be consistent with the phenomenon of dematerialization or decreased intensity of use of a commodity with an increasing GDP in mature economies (Wernick and others, 1996). In contrast, consumption per capita of aluminum has grown slowly and steadily from 17 kilograms per person in 1965 to 30 kilograms per person in 1995. This may be due to substitution of aluminum for steel in many manufactured goods. For Korea, per capita commodity use has grown exponentially for aluminum, cement, and copper. Growth of per capita consumption of salt has been significantly slower. Growth of these first three commodities mirrors the industrialization of Korea. Japan shows patterns of commodity use that are intermediate between those in the United States and Korea. This reflects the fact that Japan industrialized after the United States and before Korea. Japan shares Korea's pattern of salt use. Both countries lack primary supplies of petroleum that form the basis for petrochemicals.
Secondly, the figures suggested that per capita consumption of a particular commodity, especially industrial minerals, may vary across countries even when they have reached similar levels of development. By 1995, the United States and Japan had reached similar levels of development. The two countries were quite similar in terms of their per capita production of aluminum, 30 and 31 kilograms per person respectively, and copper, 10 and 12 kilograms per person respectively. The United States and Japan differ, however, in terms of their per capita consumption of cement, 345 and 618 kilograms per person respectively, and salt, 184 and 76 kilograms per person respectively. They suggested that the difference in salt consumption might be attributed to two factors. First, about 25% of the salt consumed in the United States is used for highway deicing (Kostick, 1992) and second, the U.S. chemical industry is a major user of salt. Differences in the per capita consumption of cement is surprising given the physical size of the United States and our preference for large buildings. Some of the difference may reflect U.S. preference for use of asphalt paving of highways and a greater use of wood as a building material. In any event, it was noted that there may be differences in the level of per capita consumption of mineral commodities among countries that reflect cultural preferences, climate, types of industry and other factors.
Beyond these two observations of the earlier study, the order in which growth began in Korea may also be significant. Cement consumption grew earlier than copper that grew earlier than aluminum. This could reflect development of basic infrastructure, followed by development of workplaces and light manufacturing, followed by manufacture of heavier structural goods.
Finally, the earlier study examined the response of birth rates to increasing industrialization, consumption of materials, and rising per capita GDP. They prepared a graph, figure 7, which shows population changes in Japan, Korea, and the United States since 1965. Population was indexed to the base year of 1965, when the population of the Japan was 98.9 million, the population of Korea was 25.1 million, and the population of the United States was 194.3 million. Japan and the United States have experienced similar average annual population growth rates over the last 30 years (0.8% for Japan, 1.0% for the United States), while population growth rates in Korea have declined from about 5% (1965-1970) to about 1% (1985-1995).
The results of the earlier study, particularly the decline in Korea's population growth concomitantly with increased per capita consumption, raises the question of whether the achievement of one of the keys to global sustainability, a decline in the rate of population growth, will require an increase in per capita material consumption that would be expected to increase environmental residuals significantly and would exceed the carrying capacities of natural systems to absorb them. If so sustainable development would seem to be a paradox. If declines in population growth require increased per capita consumption, either the efficiencies with which materials are used will have to increase dramatically, or environmental residuals associated with material consumption will have to be reduced dramatically.
Mineral Consumption in the 20 Most Populous Countries
This study examines changes in consumption of the same four mineral products (aluminum, hydraulic cement, refined copper, and salt) for the twenty most populous countries in the world as of 1996 for the period 1970 to 1995. As in the earlier study data will be examined for years ending in 0 and 5. These countries (China, India, the United States, Indonesia, Brazil, Russia, Pakistan, Japan, Bangladesh, Nigeria, Mexico, Germany, Philippines, Vietnam, Iran, Egypt, Turkey, Thailand, the United Kingdom, and France) contained over 70% of world population on about 22% of the Earth's land surface. All 20 of these countries were included in figure 1. The goal of the study is to confirm the patterns of consumption identified in the earlier study, to identify new patterns of consumption if present, and to draw implications about changing patterns of consumption.
As in the earlier study, mineral production (primary and secondary), mineral exports, and mineral imports are used to estimate apparent consumption of the mineral products. In the present study several data availability issues need to be noted. First, data on mineral production and trade data were not sufficient to determine consumption patterns all of the four commodities for Bangladesh, Nigeria, and Vietnam. In addition, data for Pakistan were insufficient to determine a pattern of copper consumption. Second, as a result of the reunification of Germany, and the dissolution of the former Soviet Union, patterns of consumption for Germany and Russia may show patterns that reflect their changed political status in 1995.
Table 1 lists and figure 8 is a plot of the per capita consumption of aluminum for the seventeen countries which report statistics for aluminum production and trade for the years 1970, 1975, 1980, 1985, 1990, and 1995. Per capita consumption of aluminum varies from 0 to more than 35 kilograms per person. Figure 8 includes too many countries to be able to identify consumption trends in many of the countries. Therefore figure 9 shows a plot of per capita consumption for the developed countries -- France, Germany, Japan, the United Kingdom, and the United States. Per capita consumption in France, Germany, Japan, and the United States has grown 1.7, 1.8, 3.1, and 1.5 percent per year respectively. Figure 10 shows a plot of per capita consumption for four developing countries -- China, Mexico, Turkey, and Thailand, which have experienced significant growth in consumption of aluminum. The average rate of growth of aluminum consumption in China for the 25 years from 1970 to 1995 has been 9.9 percent per year, and the average growth rate for the10 years from 1985 to 1995 has been 13.8 percent per year. The average rate of growth of aluminum consumption in Mexico for the 25 years from 1970 to 1995 has been 6.2 percent per year, and the average growth rate for the10 years from 1985 to 1995 has been 8.6 percent per year. Thailand has shown the most impressive growth. The average rate of growth of aluminum consumption in Thailand for the 25 years from 1970 to 1995 has been 11.5 percent per year, and the average growth rate for the10 years from 1985 to 1995 has been 18.8 percent per year. Growth in Turkey has been slower. The average rate of growth of aluminum consumption in Turkey for the 25 years from 1970 to 1995 has been 7.2 percent per year, and the average growth rate for the 10 years from 1985 to 1995 has been 3.6 percent per year. The average rate of growth of per capita aluminum consumption in the Republic of Korea for the ten years from 1985 to 1995 was 12.2 percent per year. Growth has also occurred in other developing countries but has either been at a slower rate or has not reached similar levels of per capita consumption.
Table 2 lists and figure 11 is a plot of per capita consumption of hydraulic cement for the seventeen countries with reported statistical data on production and trade for the years 1970, 1975, 1980, 1985, 1990, and 1995. Per capita consumption of hydraulic cement varies from 0 to almost 700 kilograms per person for the 20 most populous countries. The Republic of South Korea reached a per capita consumption of hydraulic cement of 1.2 metric tons per person. Figure 11 shows too many countries to allow individual trends to be identified for many countries. Figure 12 shows the per capita consumption of hydraulic cement in five developed countries. Generally, per capita consumption in the developed countries has been relatively flat. Consumption in the five developed countries differs considerably from country to country. Consumption in Japan was the highest of the five countries; it fluctuated about 600 kilograms per person. Consumption in the UK is the lowest of the five countries at less than 300 kilograms per person. Differences in per capita cement consumption likely reflect building codes and road building practices. Figure 13 shows the per capita consumption of four developing countries -- China, Egypt, Turkey, and Thailand, which show significant growth in consumption. Per capita consumption of hydraulic cement in China grew at an average rate of 14.9 percent per year for the 25 years between 1970 and 1995, and grew at an average rate of 11 percent per year between 1985 and 1995. Per capita consumption of hydraulic cement in Egypt grew at an average rate of 4.6 percent per year between 1970 and 1995. This growth however occurred mainly before 1985. Since 1985, growth of per capita consumption of cement has averaged only 1.4 percent per year. In Turkey growth of per capita consumption of hydraulic cement has been steady through out the period 1970 to 1995, averaging 3.9 percent per year. Per capita consumption of cement in Thailand averaged 8.8 percent between 1970 and 1995, and averaged 13.5 percent between 1985 and 1995.
Cement production results in significant environmental residuals being released to the atmosphere. About one ton of carbon dioxide is released to the atmosphere for every ton of cement clinker produced (van Oss and Padovani, 2003). Concerns over global climate change have led to the negotiation of national targets for carbon dioxide releases. Although fossil fuels are by far the largest source of carbon dioxide emissions, significant growth in the per capita consumption of cement in developing countries will add to the to the problem of limiting carbon dioxide emissions and could pose a problem for the industry.
Table 3 lists and figure 14 is a plot of per capita consumption of refined copper for sixteen countries, with reported statistical data on production and trade for the years 1970, 1975, 1980, 1985, 1990, and 1995. The table and figure only contain sixteen countries because, in addition to lack of data for Bangladesh, Nigeria, and Vietnam, there are too few data for Pakistan to identify consumption trends. Per capita consumption of refined copper in all countries mainly varies from 0 to 15 kilograms per person. In 1990, Germany reached a per capita consumption of 17 kilograms per person. Figure 15 is a plot of per capita consumption of copper in the five countries with developed economies. In general the per capita consumption of copper changed little for the five countries between 1970 and 1995. Per capita consumption dropped slightly in the US and significantly in the UK. It increased at a rate of 1.0 percent per year in Japan and 1.5 percent per year in France. In the Federal Republic of Germany per capita copper consumption increased at a rate of 1.9 percent per year between 1970 and 1990. Per capita consumption of copper in Germany following reunification of the German Democratic Republic and the Federal Republic of German, was 12.6 kilograms per person, considerably less than the 17.3 kilograms per person in the Federal Republic of Germany in 1990. Figure 16 is a plot of per capita consumption of copper in four developing countries -- China, Iran, Thailand, and Turkey, which show significant growth in consumption. Per capita consumption has increased the most in Thailand and Turkey, neither of which consumed copper in 1970. Growth of per capita copper consumption has been steadier in Turkey where consumption grew at a rate of 3.3 percent per year between 1985 and 1995. In Thailand per capita copper consumption grew at a rate of 17.5 percent per year between 1985 and 1995. Per capita copper consumption has grown at a rate of 16.5 percent per year between 1970 and 1995. Growth has slowed during the second half of the time period, averaging 7.5 percent per year. Per capita copper consumption grew at 10.3 percent per year between 1970 and 1995. Between 1985 and 1995, copper consumption per person grew at a 16.7 percent rate. Consumption has also grown dramatically in Indonesia, however per capita consumption in 1995 was less than half the level recorded in China in the same year.
Table 4 lists and Figure 17 is a plot of per capita consumption of salt for eighteen countries, with reported statistical data on production and trade for the years 1970, 1975, 1980, 1985, 1990, and 1995. The table and figure contain eighteen countries; countries that lack data are Nigeria, and Vietnam. Salt differs from the three mineral commodities discussed earlier in an important respect -- world per capita consumption of salt (production divided by world population) dropped between 1970 and 1995. In the 18 countries shown in figure 17, per capita consumption of salt has generally been between a few kilograms per person and 200 kilograms per person. Figure 18 shows the per capita consumption of salt in the five developed countries. Per capita consumption of salt has fallen slightly in France, the UK, and the United States. Per capita consumption has risen slightly in Japan. The plot of per capita consumption of salt for Germany shows more variability than other countries due to reunification. Per capita consumption of salt rose in the Federal Republic of Germany through 1990 but per capita consumption fell in the reunified Germany in 1995. Of developing countries, Brazil has experienced significant growth in salt consumption.
Some Implications of the Changing Patterns of Consumption
The earlier work (DeYoung and Menzie, 1999) and the present work examine the relations among population, GDP, and mineral consumption. The relations among these variables will have a significant bearing upon the goal of attaining sustainable development. Examination of cross-sectional data on GDP per capita and population growth rate for the 20 most populous countries of the world (figure 1) suggests that countries with GDP per capita above $10,000 have lower rates of population growth than do countries with GDP per capita below that level. Countries with GDP per capita above $10,000, however, have much higher rates of consumption per capita than do countries whose GDP per capita is below that level. As Korea changed from a developing to a developed economy between 1965 and 1995, it increased its per capita consumption of aluminum, cement, and copper and decreased its annual population growth from 5 percent to 1 percent. Based upon their study of mineral consumption in Japan, Korea, and the United States, DeYoung and Menzie (1999) hypothesized that per capita consumption of some commodities such as cement and copper stabilizes in developed countries, while per capita consumption of other commodities such as aluminum continues to grow. The present study, which includes additional developed countries (Germany, UK, and France), supports this finding. Per capita consumption of cement and copper do not change greatly over relatively long periods and per capita consumption of aluminum continues to increase in most of the developed countries. In addition, the present study identifies additional countries that are significantly increasing consumption of aluminum, cement, and copper. China, Thailand, and Turkey show significant increases in the per capita consumption of all three commodities. Several other countries show significant increases in one of the commodities -- aluminum (Mexico), cement (Egypt), and copper (Iran). Other of the twenty most populous countries, such as India, and Indonesia, show increases in per capita consumption of several commodities but their growth is not as advanced as the previously mentioned countries.
Together these results lead to several implications. First, the results suggest that there could be major increases in mineral consumption with in the next twenty-five years. For example, in 1970 Korea's per capita consumption of copper was negligible; by 1995, Korea's per capita consumption of copper was 14 kilograms per person. In 1970, China's per capita consumption of copper was about one quarter of a kilogram per person; by 1995 China's per capita consumption of copper was more than one kilogram per person, or about 1.3 million tons per year. This represents a growth rate of about 6 percent per year. If China's growth in consumption continues at about the same rate for the next twenty-five years, her per capita consumption of copper would be about 4.8 kilograms per person. If this rate of increase in per capita consumption is maintained for the next twenty-five years and China's population continues to grow at it's current rate, China's consumption of copper in 2020 could exceed 8 million tons. Total world consumption of copper in 1995 was 10.5 million tons. If China's rate of growth of per capita consumption of copper were to increase to a per capita consumption of 10 kilograms per person, her consumption of copper in 2020 could be nearly 17 million tons. Thus, if China's per capita consumption of copper continues to increase her consumption of copper in 2020 could exceed that of the entire world in 1995. Second, because per capita consumption in developed countries is relatively stable, most growth in consumption will take place in developing countries. Third, this increased consumption will be accompanied by an increase in environmental residuals, many of which will be exported to the air and water and some of which are currently not accounted.
Some Further Considerations
The preceding analysis of the physical measures of "consumption," or materials that are depicted as "used" by the world's economies, has been confined to material flows that are accounted for in commercial records (for example production and trade reports). There is increasing concern and study about the materials that are moved (or "flow") as a result of economic activities, but are not included in commercial accounts.
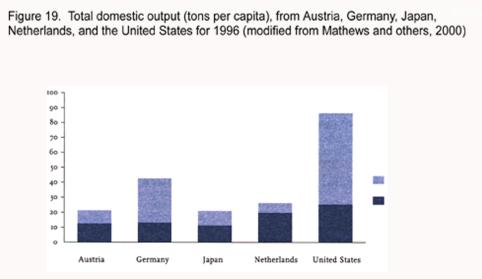
In August 2000, the World Resources Institute (WRI) in Washington, D.C., released a new report, The Weight of Nations (Mathews and others, 2000), that accounts for material flows that are outputs to the environment from industrial economies. This report completes an analysis of the materials cycle started in 1997 with a study of the total mineral requirements (inputs) to several industrial economies.
In addition to those materials that become additions to a nation's stock of infrastructure and durable goods, the most recent WRI study quantifies two types of materials. The first includes materials used and then discarded in the production process (DPO); the second includes the additional "hidden flows" that are not measured in economic accounting (overburden in mining, soil erosion related to farming, and other human activities). Together, these amounts, called Total Domestic Output, represent the total quantities of material outputs and material displacement within national borders. Figure 19 shows the total domestic output, including DPO (light blue part of the bars) and "hidden flows" (dark blue part of the bars) for Austria, Germany, Japan, Netherlands, and the United States (USA). For the United States, this shows over 25 tons per person of domestic process output and over 60 tons per person of "hidden flows" were returned to the environment per year. Coupled with prospects of significantly increased consumption of mineral commodities in developing economies, these additional quantities of moved materials add complexity to the task of achieving sustainable development.
References
DeYoung, J.H., Jr., and Menzie, W.D., 1999, The changing uses of mineral information -- A government perspective, in Otto, James, and Kim, Hyo-Sun, eds., Proceedings of the Workshop on the Sustainable Development of Non-Renewable Resources Towards the 21st Century: New York, New York, 15-16Oct 98: New York, New York, United Nations Development Program, p. 111-127.
Mathews, Emily, Amann, Christof, Bringezu, Stefan, Fischer-Kowalski, Marina, Huttler, Walter, Kleijn, Rene, Moriguchi, Yuichi, Ottke, Christian, Rodenburg, Eric, Rogich, Don, Schandl, Heinz, Schutz, Helmut, Van Der Voet, Ester, and Weisz, Helga, 2000, The weight of nations -- Material outflows from industrial economies, World Resources Institute, Washington, D.C., 125 p.
Meadows, D.L., Meadows, D.H., Randers, Jorgen, and Behrens, W.W., III, 1972, The limits to growth: New York, N.Y., Signet Books, 207 p.
U.N. World Commission on Environment and Development, 1987, Our common future: Oxford, Oxford University Press, 383 p.
U.S. Bureau of Mines, 1968-93, Minerals Yearbook (1967-91): Washington, D.C., U.S. Government Printing Office (chapters for aluminum, cement, copper, and salt).
U.S. Geological Survey, 1996-97, Minerals Yearbook (1995-96): Washington, D.C., U.S. Government Printing Office (chapters for aluminum, cement, copper, and salt).
van Oss, H.G. and Padovani, A.C., 2003, Cement manufacture and the environment -- Part II -- Environmental challenges and opportunities: Journal of Industrial Ecology, v. 7, no. 1, p. 93-126.
Wellmer, F.W., and Kursten, Martin, 1992, International perspectives on mineral resources: Episodes, v. 15, no. 3, p. 182-194.
Wernick, I.K., Herman, Robert, Govind, Shekhar, and Ausubel, J.H., 1996, Materialization and dematerialization -- Measures and trends: Daedalus (Journal of the American Academy of Arts and Sciences), v. 125, no. 3, p. 171-198.
Table 1. Aluminum consumption per capita (tons per person) in 17 of the 20 most populous countries in the world.
1970 1975 1980 1985 1990 1995
China 0.00018 0.00056 0.00043 0.00052 0.00075 0.00189
India 0.00029 0.00028 0.00040 0.00042 0.00050 0.00063
USA 0.02040 0.02087 0.02290 0.02505 0.02514 0.02977
Indonesia 0.00004 0.00016 0.00022 0.00024 0.00047 0.00078
Brazil 0.00096 0.00189 0.00313 0.00278 0.00248 0.00394
Russia 0.00298 0.00426 0.00578 0.00813 0.00824 0.00333
Pakistan 0.00000 0.00012 0.00009 0.00012 0.00012 0.00024
Japan 0.01424 0.01527 0.02372 0.02033 0.03323 0.03098
Mexico 0.00090 0.00093 0.00120 0.00179 0.00261 0.00407
Germany 0.01499 0.01636 0.02320 0.02285 0.03706 0.02374
Philippines 0.00021 0.00019 0.00038 0.00020 0.00045 0.00077
Iran 0.00035 0.00201 0.00064 0.00122 0.00212 0.00214
Egypt 0.00002 0.00031 0.00260 0.00181 0.00120 0.00151
Turkey 0.00045 0.00168 0.00089 0.00181 0.00221 0.00258
Thailand 0.00035 0.00054 0.00099 0.00095 0.00254 0.00531
UK 0.01155 0.01039 0.00860 0.00965 0.01196 0.01169
France 0.00919 0.00996 0.01373 0.01239 0.01613 0.01417
Table 2. Hydraulic cement consumption per capita (tons per person) in 17 of the 20 most populous countries in the world.
1970 1975 1980 1985 1990 1995 2000
China 0.012 0.032 0.080 0.136 0.173 0.386 0.429
India 0.025 0.026 0.029 0.045 0.059 0.059 0.098
USA 0.342 0.297 0.321 0.363 0.324 0.345 0.374
Indonesia 0.008 0.020 0.036 0.054 0.060 0.122 0.091
Brazil 0.101 0.162 0.184 0.153 0.171 0.160 0.243
Russia 0.382 0.472 0.462 0.467 0.483 0.236 0.193
Pakistan 0.000 0.028 0.032 0.048 0.063 0.070 0.065
Japan 0.528 0.550 0.678 0.531 0.653 0.618 0.562
Bangladesh 0.036
Nigeria 0.043
Mexico 0.149 0.205 0.243 0.211 0.258 0.242 0.287
Germany 0.618 0.523 0.548 0.407 0.586 0.568 0.465
Philippines 0.060 0.079 0.073 0.047 0.131 0.153 0.280
Iran 0.088 0.197 0.205 0.264 0.228 0.252 0.280
Egypt 0.099 0.096 0.139 0.293 0.305 0.303 0.414
Turkey 0.176 0.248 0.261 0.314 0.405 0.462 0.494
Thailand 0.067 0.078 0.112 0.154 0.382 0.546 0.315
UK 0.296 0.284 0.247 0.246 0.287 0.224 0.259
France 0.543 0.526 0.499 0.362 0.440 0.326 0.344
Table 3. Copper consumption per capita (tons per person) in 17 of the 20 most populous countries in the world.
1970 1975 1980 1985 1990 1995 2000
China 0.00022 0.00016 0.00038 0.00049 0.00051 0.00101 0.00168
India 0.00010 0.00006 0.00009 0.00014 0.00013 0.00013 0.00040
USA 0.01005 0.00794 0.00976 0.00664 0.00794 0.00962 0.01125
Indonesia 0.00001 0.00005 0.00014 0.00009 0.00018 0.00043 0.00030
Brazil 0.00054 0.00121 0.00229 0.00164 0.00119 0.00157 0.00225
Russia 0.00239 0.00270 0.00394 0.00312 0.00342 0.00060 0.00138
Japan 0.00894 0.00794 0.01060 0.01094 0.01279 0.01154 0.01034
Mexico 0.00098 0.00090 0.00191 0.00182 0.00140 0.00053 0.00580
Germany 0.01195 0.01308 0.01278 0.01398 0.01727 0.01255 0.01643
Philippines 0.00011 0.00008 0.00010 0.00001 0.00032 0.00048 0.00022
Iran 0.00012 0.00023 0.00003 0.00030 0.00085 0.00140 0.00159
Egypt 0.00002 0.00009 0.00005 0.00005 0.00006 0.00007 0.00007
Turkey 0.00000 0.00027 0.00060 0.00180 0.000183 0.00250 0.00259
Thailand 0.00000 0.00005 0.00010 0.00053 0.00097 0.00265 0.00259
UK 0.01017 0.01001 0.00795 0.00724 0.00722 0.00509 0.00618
France 0.00678 0.00773 0.0857 0.00684 0.00840 0.00993 0.00988
Table 4. Salt consumption per capita (tons per person) in 17 of the 20 most populous countries in the world.
1970 1975 1980 1985 1990 1995
China 0.019 0.032 0.017 0.013 0.017 0.024
India 0.010 0.010 0.011 0.013 0.011 0.011
USA 0.221 0.183 0.183 0.175 0.162 0.184
Indonesia 0.001 0.002 0.008 0.004 0.005 0.006
Brazil 0.020 0.020 0.031 0.021 0.033 0.049
Russia 0.050 0.053 0.054 0.057 0.049 0.028
Pakistan 0.004 0.005 0.007 0.007 0.006 0.008
Bangladesh 0.000 0.000 0.000 0.000 0.004 0.003
Japan 0.071 0.066 0.073 0.066 0.075 0.076
Mexico 0.016 0.030 0.020 0.024 0.017 0.006
Germany 0.151 0.137 0.166 0.185 0.232 0.141
Philippines 0.005 0.006 0.008 0.009 0.009 0.010
Iran 0.013 0.020 0.015 0.015 0.014 0.014
Egypt 0.010 0.016 0.014 0.022 0.018 0.028
Turkey 0.017 0.002 0.014 0.021 0.029 0.023
Thailand 0.002 0.001 0.001 0.002 0.003 0.007
UK 0.154 0.128 0.128 0.126 0.111 0.112
France 0.107 0.103 0.132 0.118 0.103 0.100