USGS Open-File Report 03-474, G1-03-GM, Gas Hydrates Cruise Report, R/V Gyre, 1-14 May, 2003, Northern Gulf of Mexico
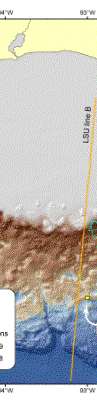
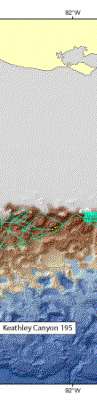
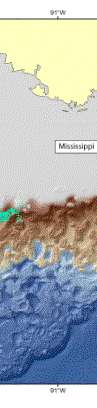
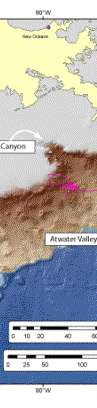
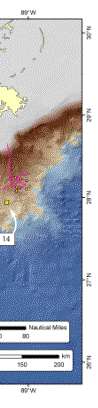
Figure 1. Map showing bathymetry in the northern Gulf of Mexico, locations of survey areas (Keathley Canyon 195 and Atwater Valley 14), and selected pre-existing data sets that were used to plan cruise G1-03-GM. Bathymetry is from NGDC Coastal Relief Model for the Gulf of Mexico (the brown/blue transition is at 1300 m). Tracklines for USGS 1999 and USGS 1998 are from Hart and others (2002).
 |
 |
 |
 |
 |
 |
