USGS Open-File Report 03-474, G1-03-GM, Gas Hydrates Cruise Report, R/V Gyre, 1-14 May, 2003, Northern Gulf of Mexico
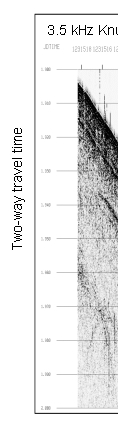
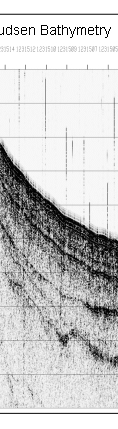
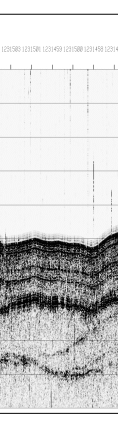
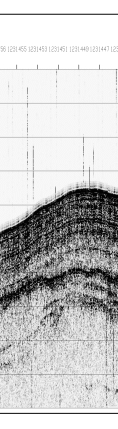
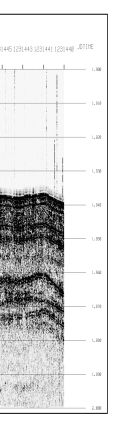
Figure 7. Example of bathymetric data taken using the Knudsen system along line KC1 in the Keathley Canyon region. This portion of the line is from the start of line Test2, and is located coincident with the west central portion of KC1. Horizontal tic marks are 2-minute time markers. Vertical scale is two-way travel time with tic lines shown every 10 ms. Data are highly vertically exaggerated: horizontal distance shown is about 5 km; vertical distance shown is about 75 m. Vertical noise bursts randomly across the record are interference from the GI gun shots.
 |
 |
 |
 |
 |
