1 U. S. Geological Survey, Denver, Colorado
2 Environmental Protection Agency, Denver, Colorado
This report is preliminary and has not been reviewed for conformity with U.S. Geological Survey editorial standards or with the North American Stratigraphic Code.
Any use of trade, firm, or product names is for descriptive purposes only and does not imply endorsement by the U.S. Government.
U.S. DEPARTMENT OF THE INTERIOR
U.S. GEOLOGICAL SURVEY
The vermiculite mineral deposit near Libby, Montana was mined from the 1920's to 1990. During this period, the Libby mine was a major source of the nation's vermiculite, which was used in a variety of applications such as loose-fill insulation, additives to potting soil, packing materials for hazardous chemicals, and many others. Asbestiform amphiboles occur in veins throughout the deposit (e.g. Pardee and Larsen, 1929) and it is difficult to separate all asbestos from the vermiculite. This paper shows that the amphibole asbestos also occurs intergrown in the vermiculite, between the layers of the vermiculite sheet silicate.
The Asbestiform amphiboles from the Libby deposit have been linked to elevated occurrences of health problems in the Libby population (e.g. Amandus et al., 1987), including miners and mill workers exposed occupationally to dusts containing the amphiboles, as well as residents with no occupational exposures (Lybarger et al., 2001; Dearwent et al., 2000; McDonald et al., 1986). The town of Libby and the surrounding region are currently being evaluated by the U.S. Environmental Protection Agency (EPA) to assess the extent of potential asbestos contamination in buildings and soils. The EPA and its contractors have identified a region covering dozens of square miles in and around Libby to be assessed, which will require the collection of many thousands of samples to be analyzed for the potential presence of fibrous or asbestiform amphiboles.
Detection of asbestiform amphibole contamination can be difficult in certain situations. For example, in the case of Libby vermiculites, amphibole fibers can grow in between vermiculite layers (Figure 1). The index of refraction of vermiculite and the tremolite-richterite-winchite amphibole compositions found at Libby are nearly identical, thus normal optical microscopy methods will likely not be able to distinguish the presence of embedded amphiboles. Surface methods such as Transmission Electron Microscopy (TEM) and Scanning Electron Microscopy (SEM) do not probe into the vermiculite grains. In other cases, the fibers may be too small to easily detect with standard optical microscopy methods (OSHA Regulations Standards 29-CR, 1995). Finally, with so many samples needing characterization, a low cost, rapid method is needed to detect Libby amphiboles.
In this paper, we present the reflectance spectral properties of geologic
materials from the Libby region and show how reflectance spectroscopy can be
used as a rapid assessment tool. This report also discusses some
limitations of this tool.
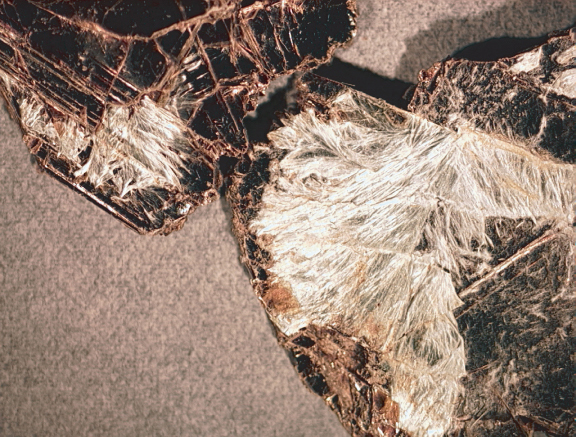
Figure 1. Richterite fibers that grew in between the layers of vermiculite/hydrobiotite in the Libby, MT deposit. This photo shows the light colored tremolite/richterite fibers after a book of vermiculite was split apart. The image is about 3.5 cm across.
A rapid assessment tool should be fast (measurements in minutes, with
seconds desirable), require no sample preparation and be able to assess large
volumes of material quickly with detection thresholds approximately
constrained. Conditions of false negatives or positives should be known so
that samples can be flagged for other analyses. The tool should
reduce the workload of more expensive and longer analyses. Ideally, the
tool could be easily deployed on site. A rapid assessment tool is not
required to derive accurate abundances because detection above a
threshold may be sufficient to identify samples containing the material of
interest. If the methodology can flag sufficient numbers of samples,
thereby reducing the number of samples needing analysis by
other, longer and more expensive methods, then
the use of rapid assessment strategy is warranted. This multi-level strategy
we call the "Sieve" Strategy of Analyses (Figure 2).
Figure 2. Different assessment strategies are shown. Each analysis has its own strengths, whether it is high accuracy or low cost, but no current analysis is rapid, very accurate and low cost. A reasonable approach is a combination of methods which can assess some samples quickly and at low cost, leaving fewer samples that need more expensive analyses. RS is Reflectance Spectroscopy, PLM is Polarized Light Microscopy;, SEM is Scanning Electron Microscopy, XRD is X-Ray Diffraction, and TEM is Transmission Electron Microscopy.
Reflectance spectroscopy is a tool where electromagnetic radiation can be used to probe a surface and, through the absorption features in the spectrum of the scattered light, can be used to identify materials. Further, the sample needs no preparation, and with modern portable instruments, high quality reflectance spectra of a sample may be obtained in just a few seconds. Conditions of false negatives and false positives can be identified by a trained analyst. Accurate abundances are usually difficult to determine with reflectance spectroscopy, but approximate thresholds can be determined (e.g. see Clark and Roush, 1984; Clark 1999 and references therein). The characteristics of this methodology are therefore well suited for use as a rapid screening tool.
As photons enter a mineral, some are reflected from grain surfaces, some pass through the grain, and some are absorbed. Those photons that are reflected from grain surfaces or refracted through a particle are said to be scattered. Scattered photons may encounter another grain or be scattered away from the surface so they may be detected and measured. The more material the photons pass through, the greater the relative absorption feature strengths will appear in the observed spectrum. See Clark (1999) and references therein for a recent review of reflectance spectroscopy and the spectral features of geologic materials.
Reflectance of a particulate surface is complex and the optical path of photons is a random walk (e.g. see Clark and Roush, 1984). At each grain the photons encounter, a certain percentage are absorbed. If the grain is bright, like a quartz grain at visible wavelengths, most photons are scattered and the random walk process can go on for hundreds of encounters. If the grains are dark, like magnetite or charcoal, the majority of photons will be absorbed at each encounter and essentially all photons will be absorbed in only a few encounters. This darkens the reflectance in greater proportion than the number of dark grains in the sample (Figure 3a; see Clark, 1999 and references therein for reviews). The random walk process, scattering and the mean depth of photon penetration are discussed in Clark and Roush (1984).
The random walk process of photons scattering in a particulate surface also enhances weak features not normally seen in transmittance, further increasing reflectance spectroscopy's sensitivity as a diagnostic tool. Consider two absorption bands of different strengths, such as a fundamental and an overtone (see Clark, 1999 for definitions of fundamental and overtone). The stronger absorption will penetrate less into the surface, encountering fewer grains because the photons are absorbed. At the wavelengths of the weaker absorption, fewer photons are absorbed with each grain they encounter, so the random walk process goes further, increasing the average photon path length. The greater path length will result in more absorption, thus strengthening the weak absorption in a reflectance spectrum (Clark and Roush, 1984).
This random walk scattering process, while enhancing detection of some features, has a complicating side effect. The controlling factor in the scattering/absorption process observed in reflectance spectra is the cross-sectional surface area, which is approximately proportional to the product of grain size and abundance. Thus, the observed reflectance of a multicomponent particulate surface is dependent on the absorption strength as a function of wavelength and of grain sizes of each component comprising the surface. The process is well understood from a theoretical basis (Hapke, 1981, 1993; Clark and Roush, 1984), and through observation (e.g. Figure 3b; Clark, 1999 and references therein).
The scattering process makes determination of abundances from reflectance spectra impossible unless the grain sizes and absorption coefficients of each component in a mixture are known (Clark and Roush, 1984). Absorption coefficients have been or can be derived for pure materials. Grain sizes can often be constrained by measuring absorption bands of different strengths in an observed spectrum, or derived from microscope images of the sample. However, without these independent measurements of grain size of each component and their optical constants as a function of wavelength, the abundance of any component can't be accurately constrained.
A rapid assessment tool need only detect the presence of the material of interest. However, understanding detection limits, which implies an understanding of abundances, is necessary for the success of such a tool. We show in this paper how reflectance spectroscopy can be used as a rapid assessment tool, even with the caveats on deriving abundances. Identification of detection failure modes is important so a sample can be sent for other testing and no sample slips through the test procedure as a false negative.
The objectives of reflectance spectroscopy as a rapid assessment tool is to screen many samples quickly, identifying those that do not need further assessment. The spectroscopy assessment may show such a strong amphibole signature as to not warrant additional testing, or have a certainty of non-detect to declare a sample "clean" of amphibole. An assessment tool should not have false negatives, meaning not detecting amphibole presence when it is truly present. It is acceptable for the method to not detect the amphibole when it is present as long as conditions can be identified to flag such a "not detectable" condition that would indicate another test is necessary. Spectroscopy can satisfy these conditions.
Spectroscopy of the electromagnetic spectrum could cover any wavelength region from gamma-rays to radio waves. For this study, we used visible to near-infrared (0.3 to 2.5 microns). This spectral range is the "reflected solar" range of the electromagnetic spectrum and commercial instrumentation is readily available with the specifications needed to resolve diagnostic absorptions to identify Libby amphiboles and other components in rocks and soils from the Libby region.
Reflectance spectroscopy may be sensitive to fibrous versus non-fibrous
amphiboles. In a non-fibrous mineral, photons will tend to traverse in
multiple directions through the crystal. But with fibrous minerals, it
is a very low probability that a photon will traverse the long axis of a
fiber, thus the absorptions along one crystallographic axis are not
probed. Depending on the contribution to absorptions in the mineral's
spectrum along that axis, a spectral feature may appear narrower or
absent in spectra of fibrous minerals. This concept, reported here for
the first time to our knowledge, will be examined at the end of this paper.
We present evidence of a small narrowing of absorptions in spectra of
fibrous Libby amphiboles compared to non fibrous minerals of similar
compositions. This narrowing is not well resolved with current field
portable instruments but is with Fourier Transform laboratory spectrometers,
Thus, at present, the use of reflectance spectroscopy screening tool is for
detecting the presence of amphibole mineralogy, and not whether it is
fibrous or asbestiform.
Figure 3a, Montmorillonite-Charcoal mixture series illustrates the non-linear spectral properties of mixtures. Only a small amount of a dark material mixed with another material will dominate the spectral properties in greater proportion than the relative abundances. From Clark (1983).
Figure 3b, Montmorillonite-Charcoal mixture series illustrates the non-linear spectral properties of mixtures. In this example, abundance is constant and the grain size of the charcoal changes in each sample is verified. The cross-sectional area of minerals as seen by photons is the controlling factor, not simply abundance or grain size alone. From Clark (1983).
In the montmorillonite-charcoal reflectance curves in Figures 3a, 3b, the reflectance level changes as does the strength of the absorption features as a function of both abundance and grain size. The absorption feature strength, called the band depth, is defined relative to the continuum as shown in Figure 4. The band depth, D, is defined as
D = 1 - Rb/Rc,
where Rb is the reflectance at the absorption band center, and Rc is the reflectance of the continuum at the same wavelength as the band center (Clark and Roush, 1984). The continuum is an estimate of the absorption due to the spectral properties of other components in the sample, and may have curvature.
Figure 4. Band depth definition (Clark and Roush, 1984; Clark et al., 2003).
An example of continuum definition and the detection of asbestos in a sample is given in the Clark et al. (2001) study of dusts from the World Trade Center. Chrysotile asbestos was found in small concentrations in many samples. The Chrysotile absorption feature, near 1.383 microns occurs on the wing of much stronger gypsum, muscovite and/or portlandite absorptions at longer wavelengths (Figure 5a; Clark et al., 2001).
The continua for isolating the chrysotile absorption in the World Trade Center dust
on Figure 5a must be curved for the most accurate definition. If a straight line
continuum is used, only higher amounts of chrysotile would be detected, with
approximately 1% limits, compared to about 0.25 % limit with the use of curved continua
(Figure 5a, 5b; Clark et al., 2001).
Figure 5a. Spectra of constructed mixtures of chrysotile and World Trade Center dust.
Figure 5b. Band depths of constructed mixtures of chrysotile and World Trade Center dust.
We have measured the reflectance spectra of thousands of EPA samples of rocks, soils, and other materials from the Libby, Montana region. Several dozens of these samples have also been analyzed by X-Ray Diffraction (XRD), Scanning electron microscopy (SEM) with energy dispersive spectroscopy for elemental compositions, and Electron Microprobe for elemental compositions. From these analyses, we find the "Vermiculite" ore contains at least 3 sheet-silicate phases: vermiculite, hydrobiotite (mixed layer vermiculite-biotite), and biotite. Hereafter, we refer the above 3 minerals simply as "vermiculite."
Wylie and Verkouteren (2000) have studied two amphibole samples from the
vermiculite mine near Libby. They determined the amphibole in both
samples to be winchite, partially based on the classification system of
Leake et al.. (1997). Previously, the amphibole from the Libby
site has been called soda tremolite (Pardee and Larsen, 1929; Larsen,
1941), soda-rich tremolite (Boettcher 1966b), and richterite (Deer et
al.. 1963). Electron microprobe analyses of 30 samples shows the
Libby amphiboles have a range of compositions spanning 6 different
mineral names (Figure 6; from Meeker et al. 2002). While the
spread of compositions cover 6 amphiboles, each individual sample from
the 30 collection locations show smaller compositional range. The
average of the 30 (Figure 6) falls into the winchite category, but
individual samples we used in testing straddle the richterite-winchite
border. For simplicity, hereafter, we refer to the compositions we used in
testing as "richterite," or "Libby amphibole."
Figure 6: Generalized Libby amphibole compositions (from Meeker et al., 2003).
The Libby minerals display different levels of electrostatic charge. Each vermiculite, hydrobiotite, or biotite flake has shown some electrostatic charge, some more than others. Biotite flakes show the least charge, vermiculite the most. Ultrasonically washed "vermiculite" flakes still show charge. Richterite grains show significant charge. Richterite has been observed to electrostatically cling to vermiculite flakes.
Richterite grains have been observed to electrostatically jump to and/or cling to (Figure 7a, 7b, 7c) rubber, glass, porcelain, aluminum, and Libby vermiculite ore. The closest analogy to the observed properties is "the richterite grains appear like iron filings with everything being a magnet." These extreme electrostatic properties imply unusual mixing properties, make standards difficult to prepare because of possible clumping (Figure 8a, 8b) in natural as well as prepared samples and may result in heterogeneity on a small scale.
Detection of Libby amphibole contamination can be difficult in certain
situations. Libby amphibole fibers sometimes grow in between
vermiculite layers (Figure 1 and below). The index of refraction of
vermiculite and the tremolite-richterite-winchite fiber compositions are
nearly identical (vermiculite = 1.55-1.58, biotite = 1.61-1.70,
tremolite = 1.61, Actinolite = 1.64: Hurlbut and Klein, 1993).
Thus, normal optical microscopy methods may have difficulty
distinguishing the presence of the Libby amphiboles intergrown with
vermiculite and perhaps biotite (biotites tend to be very dark at
optical wavelengths, adding additional difficulty). Surface methods
such as TEM and SEM do not probe inside the vermiculite grains. In
other cases, the fibers may be too small to easily detect with standard
optical microscopy methods like PLM.

Figure 7a: Amphibole grains from the Libby, MT area show electrostatic charge. Here grains electrostatically cling to a ceramic pestle and are attracted to a rubber glove.
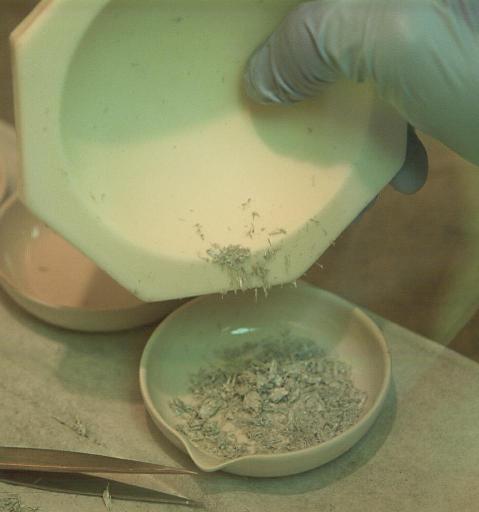
Figure 7b: Amphibole grains cling to the ceramic mortar as they are poured from the container.
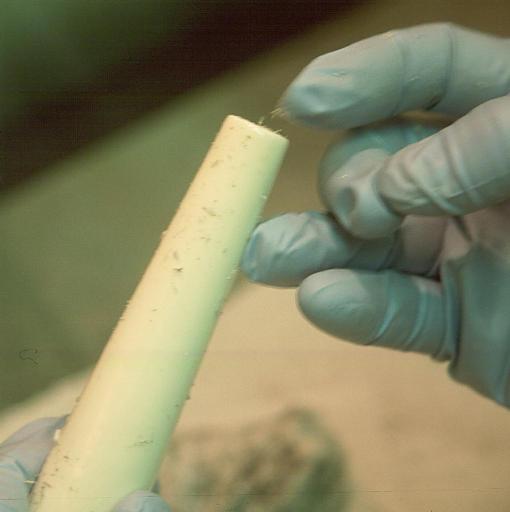
Figure 7c: Amphibole grains from the Libby, MT jump from the ceramic pestle to a rubber glove due to electrostatic charge.
Figure 8a. A cluster of amphibole fibers. Such bundles are held together by static electricity.
Figure 8b. Another cluster of amphibole fibers. Such bundles are held together by static electricity. Some of the "chunky" looking clumps are larger amphibole "cleavage fragments," but others are unresolved clouds of fibers held together with static electricity. The larger image (click on the image link above) begins to show the fibers in these clumps.
The USGS has been funded by the EPA to develop a set of standards for testing methodologies to detect Libby amphiboles. The details of the development of these test samples is beyond the scope of this document and will be reported elsewhere (S. Wilson, in preparation). Briefly, selected materials have been collected, ground and/or sieved to various grain sizes, appropriate fractions weighed, and physical mixtures created with soils and powdered minerals.
Among the concerns in standards preparation is uniformity on some reasonable scale so that methods can obtain close to the same answer within some error limit if that method were valid. For example, if testing needs 1% accuracy, the standard should be uniform on the scale of the sample measurement to at least 1%. The electrostatic properties noted above poses challenges in preparation of uniform standards. As a result, we have constructed numerous test standards to find a good procedure that can be used on a large scale. We produced standards with small-scale heterogeneity as well as small-scale homogeneity. Thus, the standards provide a possible cross section of different mixtures and uniformity that might be encountered in natural samples from the Libby region.
Of the methods being tested in this program, including PLM, SEM, TEM, XRD, and Reflectance Spectroscopy (RS), RS can rapidly probe the largest physical sample volume. Our near-infrared spectrometer can probe, for example, millimeters to many square meters in area. Photons penetrates tens of microns to several millimeters into a sample, depending on wavelength. This means that milligrams to kilograms of sample may be probed with RS. Thus, while uniformity may be an issue with some methods and some scales, RS can be used to probe the largest volume of material in a single measurement thus providing, in theory, a more uniform answer independent of small scale heterogeneities in the sample.
These standards, regardless of their uniformity, provide interesting tests of different matrices to which the amphibole is added and thus test a likely range of conditions that may be encountered in the real-world. We constructed mixtures using quartz, Libby soils, Denver Federal Center soils, and Libby vermiculite. Because Libby vermiculite may contain richterite fibers, we washed vermiculite flakes in an ultrasonic bath 19 times (14 times in water, 5 times in isopropyl alcohol. SEM images show some flakes still contain richterite (discussed below). Libby vermiculite includes some tremolite/winchite/richterite amphibole and the standards of vermiculite plus richterite therefore show more scatter in the lower concentrations. Amphibole used in the standards was obtained from fibrous amphibole veins at the Libby mine site. In general, standards were prepared for about 10% and less amphibole by weight. An exact listing of every standard will not be provided here as some standards are currently being used in blind tests at EPA and contractor laboratories.
We have studied the Libby materials and constructed standards with several methods, including:
The visible to near-infrared spectrum of Libby vermiculite and Libby amphibole, hereafter referred to simply as richterite, is shown in Figure 9, at a spectral Full Width at Half Maximum (FWHM) of about 0.01 micron (10 nm). See Clark (1999) for a discussion of spectrometer resolution and FWHM. The richterite has diagnostic absorptions near 1.393, 2.31, and 2.36 microns. At higher spectral resolution, the richterite absorption appears sharper, which will improve detection ability in mixtures. Spectral resolution effects will be discussed in a later section.
The spectral properties shown in Figure 9 indicate some similarities between both vermiculite and richterite. Starting at short wavelengths in the ultraviolet, 0.35 micron, the reflectance of both minerals first rises to the green wavelengths near 0.5 micron. The UV absorption is due to ferrous iron in both structures. From 0.5 to beyond 1.2 microns is a broad absorption with small "ripples" on the curve, also due to ferrous iron (Fe2+) in the structures. Initial measurements of vermiculites from other deposits also show iron absorptions but the strengths are different than those for the Libby vermiculites, thus the iron absorptions may be a fingerprint for Libby ore. A future paper will compare the spectra of different deposits and explore this possibility in detail.
Vermiculite contains both water and hydroxyl. The characteristic water signature is the H-O-H bend plus OH stretch combination band near 1.9 microns. The richterite spectrum (Figure 9) shows little absorption near 1.9 microns indicating only trace H2O molecules are present. The small weak 1.9-micron features are likely due to water absorbed on the surfaces of the mineral grains.
More important absorptions in both vermiculite and richterite are the
absorptions due to hydroxyl, OH, near 1.4 and 2.3 microns (Figure 9).
The small shifts and shape differences are highly significant, and
are typical of the differences between OH-bearing minerals
(e.g. Clark et al. 1990). The 1.393-micron
richterite absorption is shifted from the main OH/water vermiculite
feature near 1.4 microns as well as from other OH-bearing minerals. No
other mineral is known to have an absorption at this wavelength with
this feature width. Therefore, it is a diagnostic absorption of the
tremolite-winchite-richterite mineral (the chemistry influence the
on OH absorption position is small in this series so the spectra appear
similar). In fact, there is little change in the feature position from
tremolite to actinolite at the spectral resolution of these data (higher
spectral resolution my reveal more differences).
Figure 9. Measured spectra of real samples: Libby richterite (top), Libby vermiculite, washed 19 time in ultrasonic baths (bottom), and a constructed mixture of washed vermiculite and richterite (middle). The letter "R" points to richterite absorptions, "V" to vermiculite absorption, and "B" to biotite absorption.
The first standard prepared used ultrasonically washed vermiculite flakes, unpuffed, about a centimeter in size and a fraction of a millimeter thick. The vermiculite, shown in Figure 9, was mixed in different proportions with richterite and the spectra of each mixture was measured. An example mixture spectrum is shown in Figure 9, middle curve. On the scale of the plot, the richterite absorptions appear weak, but by continuum removal can be isolated and measured with high accuracy. A plot of the observed 1.393-micron richterite feature strength is shown in Figures 10a and 10b. At low values of added richterite, the observed data do not follow the expected trend (Figure 10b). X-ray Diffraction data of these samples also departs from the expected trend. The reason for this departure, as we have already indicated is due to richterite fibers inside the vermiculite flakes.
Figure 10a. Measured 1.393-micron richterite absorption strength is shown for constructed mixtures of richterite and the ultrasonically washed vermiculite. The ultrasonically washed vermiculite still shows a 1.393-micron feature. This feature indicates residual richterite in the vermiculite.
Figure 10b. The measured 1.393-micron feature strength from the combined mixtures. The error bar in determining the feature strength is approximately the size of the points. The deviation from the trend line (dashed line) is due to residual richterite in the ultrasonically washed vermiculite. Compare with the observed XRD results in Figure 11. For higher concentrations of richterite in the sample, the richterite coats the vermiculite grains and thus hides the residual richterite in/on the washed vermiculite flakes, so the variability is masked.

Figure 11. XRD peak height for constructed Libby vermiculite + richterite mixtures. The error bar in the measurement is approximately the size of the small rectangles. The large variation in the trend at low added weight percent richterite is due to the residual richterite in the vermiculite. Higher concentrations of richterite in the sample masks the variability in the cleaned vermiculite flakes. The reflection that was used for the peak height was the htl=(110) lattice plane, with d-spacing of about 8.45-8.56 angstroms.
In an effort to determine the extent of richterite inside vermiculite vermiculite flakes, a number of individual, ultrasonically cleaned flakes were measured with reflectance spectroscopy. The observed 1.393-micron richterite absorption was found to be quite variable in strength (Figure 12). Optically, we could detect no fibers inside the vermiculite, likely because of the close values of the index of refraction between the two minerals, as noted previously.
One vermiculite flake, flake 7, indicated the strongest 1.393-micron absorption strengths, with the implication of the most richterite in/on the flake. The flake was split with a razor blade in clean environment and pieces were examined with scanning electron microscopy (SEM). Images of one piece, 7A are shown in Figure 13a and 13b. While it is impossible to prove any one amphibole fiber in these images grew between the vermiculite layers, the correspondence here in these images with the higher amphibole abundance observed by spectroscopy and the undisputable fact of fibrous amphibole inside vermiculite flakes on a macroscopic scale from Figure 1 provides definitive evidence that the amphibole occurs inside vermiculite. Many such flakes have been observed, when split open in the field, to show the fibrous amphibole. So, while not every vermiculite flake contains the amphibole, many do.
This spectroscopic result, the individual flake results in Figure 12, the XRD results, and the observed electrostatic properties indicates the richterite abundance is highly variable and cannot easily be cleaned from the vermiculite. Randomly selected small samples could detect large or virtually no richterite (see flake variability in Figure 12). Even with sample a preparation process that includes liquids to clean a larger sample, richterite could still adhere to the vermiculite. Thus, detection in any environment can be inconsistent unless sampling can be done on a large sample volume, probing the sample undisturbed and unprocessed, such as can be done rapidly with reflectance spectroscopy. Yet to be understood is how/if the richterite fibers can be released to become airborne. What electrostatic/mechanical/humidity/other conditions will permit that release?
The importance of this discovery indicates that where unprocessed Libby vermiculite is present, even though no amphiboles are visible, there is a possibility of fibrous amphiboles occurring within the vermiculite. Disturbing the vermiculite, such as driving over flakes in a car, could break open flakes, possibly releasing fibers into the environment where they could become airborne and inhaled.
Figure 12. Measured spectra of individual Libby vermiculite flakes are shown for the 1.393-micron richterite absorption feature. The vermiculite was washed in ultrasonic baths 19 times, yet these measurements show certain grains still contain richterite. Flake 7 showed the highest spectral indication of richterite, so the flake was split with a new, cleaned razor blade and individual pieces measured. One of those pieces (the second set of measurements to the right of the "7" line on the plot) showed very high spectral indications of richterite. This piece showed many microscopic vein-like structures in the flake through a stereo microscope. SEM images of these flake are shown in figures 20-22, and show richterite fibers.
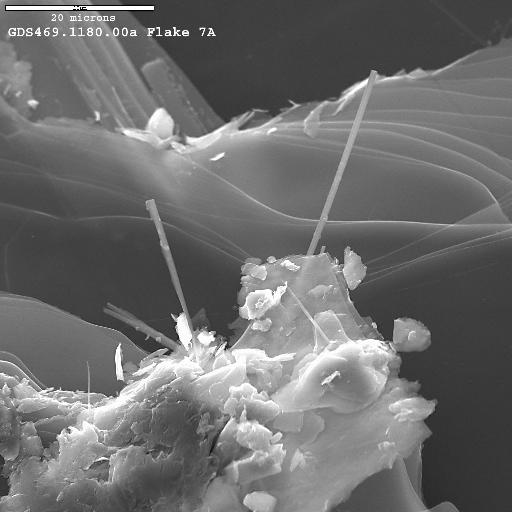
Figure 13a. SEM image of a split portion of flake 7 (see Figure 12), called flake 7a, shows richterite fibers sticking out of the edge of the flake. The richterite fibers are the long thin structures pointing from near center toward the top of the image. Are the fibers embedded in the vermiculite, or were they electrostatically adhering to the surface of the (19 times) ultrasonically washed flake and became embedded in the side during splitting of the flake?
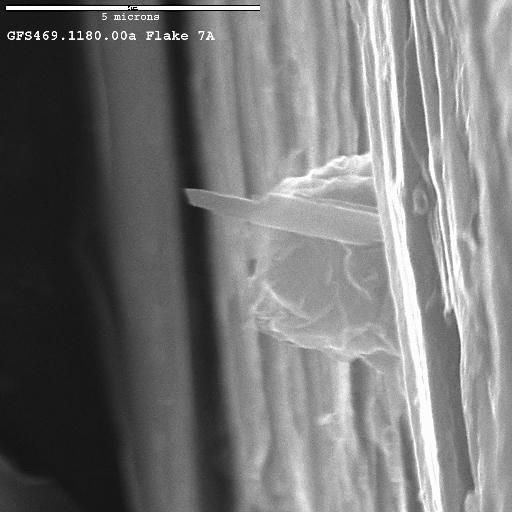
Figure 13b Another image of flake 7a showing a richterite fiber (composition consistent with amphibole Na-tremolite/winchite/richterite by energy dispersive spectroscopy (EDS) on the SEM) in the side of the vermiculite fibers. Again, did this fiber get embedded in the side during sample handling or did the richterite grow embedded between the vermiculite layers?
In order to better understand the observed trends in the constructed standards, radiative transfer modeling was done. The methods used are those described in Hapke (1981, 1993) and Clark and Roush (1984). We computed data for two general models: particulate scattering and molecular mixtures. Particulate scattering simulates the physical mixture of two or more components, each with its own grain size and abundance. The model assumes the grains are randomly distributed, and photons scatter on a mineral-air boundary. The molecular mixture assumes no scattering between mineral types and is analogous for our case to richterite grains embedded in vermiculite flakes. The model currently does not include grain shape.
Example computed spectra are shown in Figure 14a with continuum-removed 1.393-micron absorption depths shown in Figure 14b. The trends in the 1.393-micron depth as a function of abundance are shown in Figure 15. The corresponding trends in the 2.31-micron absorption are shown in Figures 16a and 16b.
The radiative transfer modeling shows that the observed trends in
absorption feature band depths as a function of mixture abundance is not
a straight line, and that different mixtures will produce different
trends.
Figure 14a. From the derived optical properties of Libby vermiculite and richterite, a series of spectra were computed to illustrate the expected trends in spectra of richterite - vermiculite mixtures. A richterite grain diameter of 0.5 microns on centimeter-size vermiculite flakes was used for these calculations. Richterite shows strong absorption features at 1.393, 2.31 and 2.39 microns. The absorption feature strengths for other grain sizes would be different from those shown here.
Figure 14b. The 1.393-micron richterite absorptions are shown from the modeled spectra in Figure 14a. The residual feature in the vermiculite spectrum (top spectrum) is probably indicative of trace richterite in the vermiculite sample from which the optical properties were derived, even after the vermiculite was ultrasonically washed 19 times.
Figure 15. The 1.393-micron richterite feature strength model for intimate mixture (from Figure 14a) and for richterite embedded in the vermiculite flakes (molecular mixture model) is shown. Different grain-size distributions will change the magnitude of the feature strengths but the overall trends will be similar. The intimate model assumes a random mixture of grains of vermiculite and richterite.

Figure 16a. The feature strengths for the 2.31-micron richterite absorption are shown from the modeled spectra in Figure 14a.
Figure 16b. The 2.31-micron richterite feature strength model for intimate mixture (from Figure 16a) and for richterite embedded in the vermiculite flakes is shown. Different grain size distributions will change the magnitude of the feature strengths but the overall trends will be similar.
In order to separate the spectral effects of the richterite absorption from the
broader vermiculite absorption, a narrower continuum was defined to produce
the information in Figures 16a, 16b. The continuum definition is illustrated
in Figure 17.
Figure 17. Same spectra as in figures 9 and 10a of constructed mixtures (not radiative transfer computed spectra), but showing the 2.31-micron feature. This feature is a combination of 3 sources: vermiculite (v), biotite (b), and richterite (r). The richterite indicator changes the curvature of the combined absorption feature. The red line indicates a continuum that is relatively insensitive to the vermiculite absorption but is sensitive to the center portion of the richterite absorption.
As discussed previously, the trend in observed feature strength as a function of mixture abundance should not be straight lines, and depending on the reflectance of the different components and their grain sizes, we should observe different trend lines with different standard series. Indeed, this is the case, as shown in Figure 18.
The different trend lines in the standards all indicate richterite levels below 1% by weight can be routinely determined. Confusion increases when abundances fall below about 0.5 wt %. As the matrix material in the mixture becomes less absorbing, photons are able to travel further into the sample, potentially encountering more richterite grains. This is the case for the quartz series. Here, quartz absorbs little in the near infrared and the sensitivity for detection of richterite grains improves to at least 0.01 wt % (Figure 19). This indicates that if a sample is dark, for example it is wet (water strongly absorbs near-infrared photons), any sample processing that can raise the reflectance (without significantly decreasing grain size) will improve detectability. In the case of wet samples, drying them will improve detectability of Libby richterite.
Because spectroscopy shows absorptions of the matrix material (e.g. see Figures 5a, 9, and 14a) and the general reflectance level of the mixture, interferences can readily be identified. This allows the analyst to determine when conditions exist where reflectance spectroscopy would be limited and thus further testing is indicated. This fact makes reflectance spectroscopy a good rapid assessment tool that can still avoid false positives and negatives.
The variability in observed trends in spectral feature strength versus abundance shown in Figure 18 is indicative of sample inhomogeneity. All samples prepared thus far show this effect at some level. The ISTM-2 series, completed after gaining experience with preparation of other samples, still shows chunks (Figure 20a, b). However, these chunks are observed in real-world samples from the Libby region so sample inhomogeneity mimics real-world experiences. The signal observed in any one measurement is then dependent on how many such clumps/chunks are near the surface. This presents a sampling challenge for all methods and will likely limit derived abundance accuracy.

Figure 18. The measured 1.393-micron absorption strength for standard series of Libby richterite mixed with quartz, a Libby soil, the ISTM 2 (Libby soil) series, and ultrasonically-washed vermiculite flakes. Because the grain size and reflectance level of each matrix material is different, different trend lines are observed.
Figure 19. Same data as in Figure 18, but showing lower abundance levels. A mixture of only 0.01 wt % richterite (100 parts per million) produces detectable absorption.

Figure 20a. ISTM2 sample GS0241 with the spectrometer fiber-optic probe at top. The threaded metal part is 0.5 inch diameter. The field of view on the sample is slightly more than about 1 inch (~ 3 cm). Small white pieces in the sample are Libby fibrous amphibole and the matrix is a typical soil from the Libby area.
Figure 20b. ISTM2 sample GS0241 close-up. Many white pieces in the sample are Libby fibrous amphiboles. The largest one is "pencil-lead size,"
Can spectroscopy be used to tell the difference between fibrous and non-fibrous varieties of amphibole and other minerals? The contribution to absorption bands are usually due to photons traversing all axes of the mineral. A chemical bond will have the greatest influence on absorption when it is perpendicular to the direction of photon travel. If photons are prevented from traversing one or more crystallographic axes, then the absorption from those axes will not contribute to the absorption. This can be done with single crystals and a polarizer, allowing study of each crystal axis. In a normal particulate surface, measured in reflectance, the photon direction is random, so all crystal axes are probed by the photons scattering in the surface. However, photons will have low probability of traversing the long dimension of fibrous crystals. Even the few photons that are oriented to encounter and travel directly along the fiber would preferentially be absorbed because of the much greater path length in the mineral. Thus, one might expect a change in the spectrum of fibrous versus non-fibrous minerals. Either an entire absorption could disappear, or simply the main absorption could appear narrower in width.
We examined a number of amphibole spectra and find that the Libby amphibole has a narrower width of the 1.393-micron OH-stretch overtone absorption than do non-fibrous amphiboles that are close in composition to the Libby amphibole. The effect observed is small, and the spectral bandpass and sampling required is on the order of 0.001 microns. Further study is required to prove and quantify this effect.
Figure 21. Fibrous versus non-fibrous effects on spectral features. The Libby amphibole is fibrous with fiber sizes typically less than 1 micron (less than the 1.4 micron wavelengths in this plot). The other richterite and tremolite are non-fibrous varieties and coarser grained. The fibrous amphibole has a narrower absorption feature.
We compared Reflectance Spectroscopy (RS) to Polarized Light Microscopy (PLM) analyses on natural samples from the Libby region. Samples were collected by the EPA and splits supplied to the USGS for analysis. Other splits were supplied to contractor labs and the data from those labs supplied to us by the EPA. We must note that because of possible sample inhomogeneity due to richterite electrostatic effects, regardless of splitting methods used, the samples may not be exactly identical in richterite content. However, examined as a whole, statistically one would expect similar trends if each method had similar detection levels. We see in Figure 22, however, that spectroscopy seems to detect more cases than PLM. Spot checking some samples in the SEM confirmed some samples that were non-detect by PLM contained richterite, however, time and funding has precluded rigorous fiber counting with TEM or SEM to determine true richterite levels, Statistically, though, from the evidence presented here, spectroscopy should be able to probe into vermiculite grains and detect richterite that would not be seen by PLM.
Figure 22. Comparison of absorption strengths observed in reflectance spectra of approximately 180 natural samples from the Libby, Montana region compared to standard Polarized Light Microscopy (PLM) measurements. Note the many non detects by PLM where reflectance spectroscopy detects richterite absorption. The NIR index 1 and 2 are scaled absorption strengths of the 1.393 and 2.31-micron features, respectively.
So far, we have discussed the spectral properties of the Libby amphiboles using spectra from an Analytical Spectral Devices portable field spectrometer with approximately 0.011 micron (11 nm) spectral bandpass (Full Width at Half Maximum; see Clark, 1999). But the 1.393-micron tremolite-winchite-richterite feature is narrower than this spectral resolution. The natural width of the absorption feature is only about 0.003 micron. A spectrometer with a narrower spectral resolution would be able to see the feature as a narrower line (Figure 23a, 23b) and be able to separate it from other absorptions at lower abundances (Figure 24).
In Figure 24 we see spectra of a mixture of Libby amphibole and Libby soil containing a strong muscovite signature at 2 spectral resolutions. At 0.011-micron resolution, the amphibole does not even produce a local minimum at 1.393 microns. Detection of the amphibole requires accurate definition of the continuum (see Figure 24, top). But at 0.0008-micron resolution, the amphibole produces a local minimum at 1.393 microns showing a readily observable and stronger absorption feature. We estimate amphibole detection should, in general, be improved approximately linearly with improvements in spectral resolution from 0.011 to at least 0.002 micron, or about a factor of 5. Higher resolution, however, may require working in a dry nitrogen atmosphere environment to reduce effects from atmospheric water absorptions.
Figure 23a. The Libby amphibole (sample ID= GDS 591) 1.393-micron absorption feature is shown at 2 spectral resolutions.
Figure 23b. The Libby amphibole (sample ID= GDS 591) 1.393-micron absorption feature is shown at 2 spectral resolutions. This is the same as Figure 23a, but a closer view to show details.
Figure 24. Spectra of a mixture of 5% Libby amphibole and Libby soil is shows at two spectral resolutions (bottom curves). At top is shown the 1.393-micron amphibole absorption, continuum removed. The higher spectral resolution shows the amphibole absorption better.
The the Libby, MT amphiboles show unusual electrostatic properties, and large variability in fibrous amphibole concentration in laboratory samples, even in washed and well mixed vermiculite-biotite samples. This variability could pose difficulty in obtaining consistent analysis results concerning amphibole content.
The variability has been observed in near-infrared spectra of Libby vermiculite samples. Other laboratory analysis confirm that this variability is a physical property of the minerals. Ore varies between vermiculite, hydrobiotite, and biotite with variable amounts of fibrous amphibole from grain to grain (from spectroscopy and XRD and SEM). The ultrasonically washed (19 times) ore sample still contains fibrous amphibole based on the presence of spectral features as well as SEM and XRD detections.
Reflectance spectroscopy can detect Libby amphiboles with detection limits near 0.5 wt % amphibole on unprepared samples. In some samples, those with a weakly absorbing matrix, detection limits are as low as 0.01 wt %, using currently available commercial portable field spectrometers. Increasing spectral resolution (using commercially available laboratory spectrometers) can improve detectability up to about 5 times (0.1 wt % on typical Libby samples and to about 0.002 wt % on weakly absorbing samples).
Reflectance spectra measured on unprepared samples can achieve excellent signal-to-noise ratio in about 0.5 minute. More than 60 samples can be measured per day by a 2-person team (5-minutes per sample), including necessary calibrations. With efficient sample handling, this number can be doubled. Analysis of Libby and World Trade Center samples to date show that reflectance spectroscopy can be an effective rapid screening tool. Reflectance spectra are a digital record of the sample. Thus in the future, better algorithms could be applied to the same data if lower detection limits become important. Analysis can be minimally biased by a human, and, depending on the algorithm, analysis can be automated. reflectance spectroscopy can be deployed in a laboratory, in the field, and from aircraft. As a rapid screening tool, reflectance spectroscopy can reduce analysis loads on more expensive but detailed analyses using the "sieve" analysis methods.
Reflectance Spectroscopy
Currently there we know of no commercial algorithms for this analysis. Detection of amphiboles at low abundances may require removal of major components from the spectra. This can be done by a simple ratio method, but the absorption band positions of the matrix material must be matched (Figure 24). Currently we do this as a custom fit using our experience in spectroscopy. A menu driven analysis system could allow an analyst to try different matrix spectra to minimize interference from absorptions in the matrix. The system would show the test spectrum ratioed by the matrix and amphibole spectral regions displayed to show if an amphibole can be detected in the spectrum, as in Figure 24.
Further information on reflectance spectroscopy can be found at:
http://speclab.cr.usgs.gov.
Amandus, H.E., Wheeler, R., Jankovic, J., and Tucker, J., 1987, The morbidity and mortality of vermiculite miners and millers exposed to tremolite-actinolite: Part I. Exposure Estimates: American Journal of Industrial Medicine, vol. 11, p. 1-14.
Boettcher, A.L., 1966, The Rainy Creek Igneous Complex near Libby, Montana, PhD thesis, The Pennsylvania State University, University Park: 155p.
Clark, R.N., 1983, Spectral properties of mixtures of montmorillonite and dark carbon grains: implications for remote sensing minerals containing chemically and physically adsorbed water: Jour. Geophys. Res., vol. 88, p. 10635-10644.
Clark, R.N. and Roush, T.L., 1984, Reflectance spectroscopy: quantitative analysis techniques for remote sensing applications: Jour. Geophys. Res., vol. 89, p. 6329-6340.
Clark, R.N., King, T.V.V., Klejwa, M., Swayze, G.A., and Vergo, N., 1990, High spectral resolution reflectance spectroscopy of minerals, Jour. Geophys. Res., vol. 95, p. 12653-12680.
Deer, W.A., Howie, R.A., and Zussman, 1963, Rock forming minerals, volume 2 chain silicates: Longmans, Green and Co. Ltd, London, 379p.
Hapke, B., 1981, Bidirectional reflectance spectroscopy 1. Theory:
Jour. Geophys. Res. v. 86, p. 3039-3054.
Hapke, B., 1993, Introduction to the theory of reflectance and emittance spectroscopy: Cambridge University Press, New York.
Hurlbut, C. and Klein, C., Jr., 1993, Manual of mineralogy (after Dana): revised 21st edition, John Wiley and Sons, N.Y.
Larsen, E.S., 1941, Alkalic rocks of Iron Hill, Gunnison County: Colorado, U.S. Geological Survey Prof. Paper 197-A, 64 p.
Leake, B.E., Woolley, A.R., Arps, C.E.S., Birch, W.D., Gilbert, M.C., Grice, J.D., Hawthorne, F.C., Kato, Akira, Kisch, H.J., Krivovichev, V.G., Linthout, Kees, Laird, Jo, Mandarino, J.A., Maresch, W.V., Nickel, E.H., Rock, N.M.S., Schumacher, J.C., Smith, D.C., Stephenson, N.C.N., Ungaretti, Luciano, Whittaker, E.J.W., and Youzhi, Guo, 1997, Nomenclature of amphiboles: report of the subcommittee on amphiboles of the International Mineralogical Association, commission on new minerals and mineral names: Am. Mineralogist, v. 82, p. 1019 - 1037.
Meeker,G., Brownfield, I., Bern,A., Lowers, H., Sutley, S., Hoefen, T.M., Plumlee, G., Clark, R.N., and Swayze, G.A., 2002, Chemistry and morphology of amphibole asbestos from Libby, Montana: Implications for the Health Mineralogic, and Regulatory Communities: Geological Soc. America, ISSN 0016-7592, 34, p. 146.
OSHA regulations standards 29-CR, 1995, polarized light microscopy of asbestos, non-mandatory - 1915.1001 App. B, method number ID-101, matrix: bulk: Federal register 33972.
Pardee, J.T. and Larsen, E.S., 1929, Deposits of vermiculite and other minerals in the Rainey Creek District near Libby, Montana: U. S. Geological Survey Bull. 805-B.
Wylie, A.G. and Verkouteren, J.R., 2000, Amphibole asbestos from Libby, Montana, Aspects of nomenclature: American Mineralogist, v. 85, p. 1540-1542.
This report is maintained by: Dr. Roger N. Clark rclark@usgs.gov
| AccessibilityFOIAPrivacyPolicies and Notices | |
| |
|