
Earthquake Hazards Program
Seismic Velocities from High-Resolution Surface-Seismic Imaging at Six ANSS Sites near Memphis, Tennessee
By
Robert A. Williams, William J. Stephenson, Jack K. Odum, and David M. Worley
This report is preliminary and has not been reviewed for conformity with U.S. Geological Survey editorial standards or with the North American stratigraphic code. Any use of trade names is for descriptive purposes only and does not imply endorsement by the USGS.
Open-File Report 03-218
U.S. Department of the Interior
U.S. Geological Survey
Golden, Colorado
Introduction
Several universities in the central United States, including the University of Memphis and St. Louis University, have recently collaborated in the installation of about thirty seismographs as part of the Advanced National Seismic System (ANSS). To better understand ground motions recorded at six of these sites, this report describes P- and S-wave velocities (Vp and Vs) in the upper 30 to 60 m measured using seismic refraction/reflection methods on the ground surface in Memphis, Arkansas, and western Tennessee (Fig. 1). We used the surface seismic method because it is a less expensive and non-invasive alternative to drilling a borehole and logging downhole velocities. In a comparison between reflection/refraction and downhole data, Williams and others (2003) found, despite significant differences in the subsurface area sampled by these two methods, that similar velocity structures were obtained. These velocity structures were similar in terms of layer thickness and velocity, and average Vs in the upper 30 m (Vs30). The main differences in the velocity-depth data between the two methods were that the downhole data tended to reveal (1) a slightly greater number of distinct velocity layers over the upper 30 m, and (2) a greater number of velocity inversions. The magnitude of these differences suggests that surface reflection/refraction data should not be used instead of downhole data if the study requires an extremely detailed depiction of velocity structure. In addition, Williams and others (2003) noted that some P- and S-wave reflection travel times can directly indicate the frequencies of potentially damaging earthquake site resonances.
Knowledge of the near-surface velocity structure is important in order to account for possible site effects at these recording sites. Previous studies have consistently shown that lower Vs30 generally correlates with increases in the average amplification of earthquake ground motion and sometimes damage (Borcherdt and Gibbs 1976; Hartzell et al. 1996). Determination of near-surface Vs is also motivated by the National Earthquake Hazard Reduction Program (NEHRP) model building code provisions that place a special significance on shallow Vs (BSSC 1997). The new building code assigns one of six soil profile types to a site, from hard rock (type A) to soft soils (type E or F), based on the Vs30 (Table 1). These soil profile categories, which are determined for each site in this study, are also part of the International Building Code adopted in 2001 (BSSC 2000).
Table 1. Site categories in NEHRP Provisions (BSSC 1997)
|
Soil Profile Type |
Rock/Soil Description |
Average S-wave Velocity (m/s) top 30 m |
|---|---|---|
|
A |
Hard rock |
> 1500 |
|
B |
Rock |
760 – 1500 |
|
C |
Very dense soil/soft rock |
360 – 760 |
|
D |
Stiff soil |
180 – 360 |
|
E |
Soft soil |
< 180 |
|
F |
Special soils requiring site-specific evaluation |
The city of Memphis is primarily located on an upland area (relative to the Mississippi River floodplain lying to the west of Memphis) whose near-surface stratigraphy consists mostly of Pleistocene loess deposits and smaller areas of Pleistocene and Holocene alluvial deposits laid down by smaller rivers and streams that have eroded the loess (Saucier 1974). The loess is generally underlain by Plio-Pleistocene sands and gravels, which are then underlain in the Memphis area by about 900 m (lesser amounts at the two sites north of Memphis) of Tertiary and Cretaceous sediments. The three ANSS sites studied in Memphis, CBHT, TUMT, and CUET, and sites CVTN and LNXT north of Memphis, are located on Pleistocene loess (Saucier, 1974). No loess is present in the vicinity of site MCAR, which is located about 15 km west of Memphis on Holocene alluvium and has also experienced more recent flooding by the Mississippi River than the other sites in this study. The loess is usually thickest, up to 27 m thick, near the Bluff line along the eastern side of the Mississippi River and thins to the east (Saucier 1974).
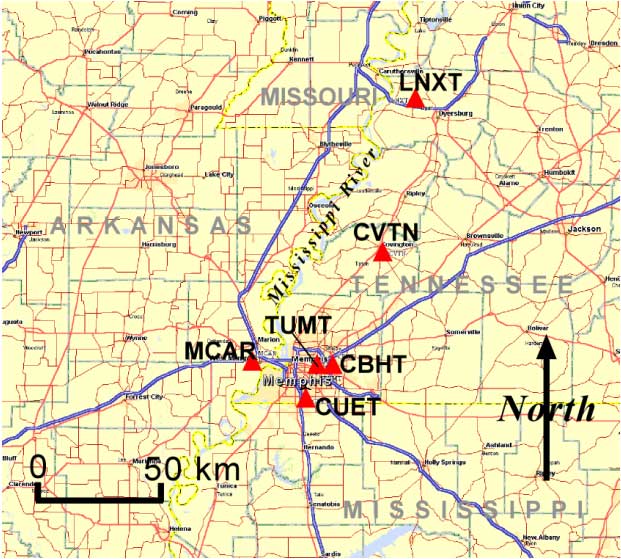
Figure 1. Map of a portion of the central United States near Memphis, Tennessee, showing the locations of the six ANSS sites (red triangles) measured for near-surface P- and S-wave velocity. Heavy blue lines are the Interstate freeways. Red and brown lines are secondary roads and light blue lines are county boundaries.
According to NEHRP guidelines, Vs30 for a layered structure is determined by:
Vs30 = ![]() , where di is
the thickness of the ith layer between 0 and 30 m and Vsi is
the shear velocity in the ith layer. The site
category can be determined using on-site measurements of soil blow counts
(spt), unconfined compressive strength, or shear-wave seismic velocity
(Vs). The site location, Vs30, and NEHRP site
classification for each site in this study are listed in Table 2.
, where di is
the thickness of the ith layer between 0 and 30 m and Vsi is
the shear velocity in the ith layer. The site
category can be determined using on-site measurements of soil blow counts
(spt), unconfined compressive strength, or shear-wave seismic velocity
(Vs). The site location, Vs30, and NEHRP site
classification for each site in this study are listed in Table 2.
Table 2. Station parameters
|
ANSS Site Name |
Site Description |
Latitude (N) |
Longitude (W) |
VS30 (m/s) |
NEHRP Site Class |
*Deeper Average Vs (m/s) |
Water Table Depth (m) |
Possible
|
Possible |
|---|---|---|---|---|---|---|---|---|---|
|
MCAR |
Mid-South Community College, Arkansas |
35o 08.698’ |
90o 13.290’ |
185 |
D |
VS50 = 216 |
7.0 |
16.0 |
0.9, 1.4 |
|
CBHT |
Christian Brothers High School, Memphis |
35o 07.956’ |
89o 51.942’ |
230 |
D |
VS45 = 255 |
17.0 |
6.0 |
|
|
CVTN |
Crestview School, Covington, Tenn. |
35o 32.672’ |
89o 38.092’ |
240 |
D |
VS60 = 270 |
2.5 |
8.0 |
1.2, 10.0 |
|
LNXT |
Lenox, Tennessee |
36o 06.068’ |
89o 29.348’ |
250 |
D |
max.=30 m |
17.0 |
6.0 |
2.0 |
|
CUET |
CUSEC headquarters, Memphis Tenn. |
35o 00.409’ |
89o 58.603’ |
265 |
D |
max.=30 m |
3.5 |
21.0 |
2.8 |
|
TUMT |
CERI Bldg., University of Memphis |
35o 07.427’ |
89o 55.932’ |
315 |
D |
VS85 = 345 |
26.0 |
5.5 |
5.5 |
*These are the deepest Vs interpreted from these data.
Seismic Data Acquisition, Processing, and Interpretation
The P- and S-wave data were recorded using a linear array of 60 geophones with 1.5 m spacing. Single component 4.5-Hz horizontal geophones were used for the S-wave data, and 8-Hz vertical geophones were used for the P-wave data. The S-wave seismic source consisted of manually striking horizontally against the end of a wooden timber, usually placed on the pavement or dirt beneath the wheels of a pickup, with a 4-kg sledgehammer. The timber was oriented at right angles to the direction of the profile. Reversed seismic profiles ranged in length from 87 to 178 m. Striking opposite ends of the timber with a 4-kg sledgehammer produced reversed-polarity S-waves. P-waves were generated with a sledgehammer striking a metal plate. The seismic profile lengths resulted in a maximum survey depth range of about 30 to 50 m, although, using S-wave seismic reflection data, we were able to extend this imaging depth to 60 and 85 m at site CVTN and TUMT, respectively. Similar studies of near-surface materials by surface seismic methods have been conducted by Campbell and Duke (1976); Williams et al. (1994); Harris et al. (1994). Recording parameters are listed in Table 3.
Table 3. Seismic refraction/reflection data recording parameters
Recording Parameter |
Seismograph Settings |
|---|---|
|
Recording system: |
24-bit Geometrics StrataView |
|
Sampling interval: |
0.001 seconds |
|
Record length: |
1 second |
|
Recording format: |
SEG-2 |
|
Geophones: |
60, 4.5-Hz horizontal, 60, 8-Hz vertical |
|
Geophone array: |
Linear, single phones at 1.5-m intervals |
|
Source: |
4.0-kg hammer on metal plate (P-wave); 4.0-kg hammer on wood timber (S-wave) |
|
Source array: |
Reversed spreads with multiple off-end shots |
The data were interpreted using the slope-intercept method of analysis (Mooney 1984), while seismic reflections were interpreted separately using a hyperbolic curve-fitting utility within the computer software ProMAXÒ (Landmark Graphics Corp., 1998). Because the seismic profiles were acquired on generally flat ground, timing corrections due to elevation variation along the profiles were unnecessary. For the slope-intercept method, after usually applying a 40- to 120-Hz and a 20- to 60-Hz bandpass filter to the P- and S-wave data (see Appendix), respectively, we picked first-arrival phases interpreted to be refracted from the same interface, and calculated the velocity from the slope of the line connecting these phases (Fig. 2). The accuracy of these first-arrival straight line fits appears to be about 5 percent (10 percent for noisy data). We have determined this in practice by intentionally mispositioning the line fit from the preferred slope to
Figure 2. Example S-wave “common-source-point” record from site LNXT showing interpretation of at least four unique first-break arrivals (red lines) and their corresponding zero-offset points. Seismic velocity, in m/s, for each red line is annotated in box. Source offset in meters is listed along the top of the record.
a less preferred slope, and then measuring the variation. Using these slopes in our refraction data interpretation we find that, because the calculated layer thickness is proportional to the product of layer velocities (e.g., Dobrin 1976, p. 297), the accuracy of layer thickness calculations is about 10 to 20 percent. In one S-wave data case at site CUET, because no layers were detected below about 15 m by reflection or refraction methods, we used a rule-of-thumb constraint to extend the maximum refractor imaging depth to about 30 m. This rule assumes that if the velocity increases with depth, then maximum refractor imaging depth is equal to about 1/3 the length of geophone array (about 90 m in this case) deployed on the ground surface (Mooney, 1984). Vertical resolution limits are about 1 to 2 m for S-wave data and about 2 to 4 m for P-wave data.
Refraction data alone are limited because of the inability to reliably detect low-velocity layers below high-velocity layers (velocity inversions). Plus, given the resolution limits described in the previous paragraph, we recognize that it is unlikely that we are detecting thin velocity inversions at all. However, to increase our chances of detecting velocity inversions greater than about 2 m in thickness, we used the methodology described by Williams and others (2003), who recommend (1) incorporating techniques, long practiced in earthquake seismology, for recognizing the presence of velocity inversions by refraction terminations and delays, and (2) including reflection data as much as possible. An example of a refraction termination at site CUET is shown in Figure 3 where we observe the fade out and eventual termination of a refraction first arrival in the middle part of the record, followed by a delayed arrival from a layer of higher velocity. With this method we interpreted velocity inversions at TUMT, CUET, and CVTN (Figure 4).
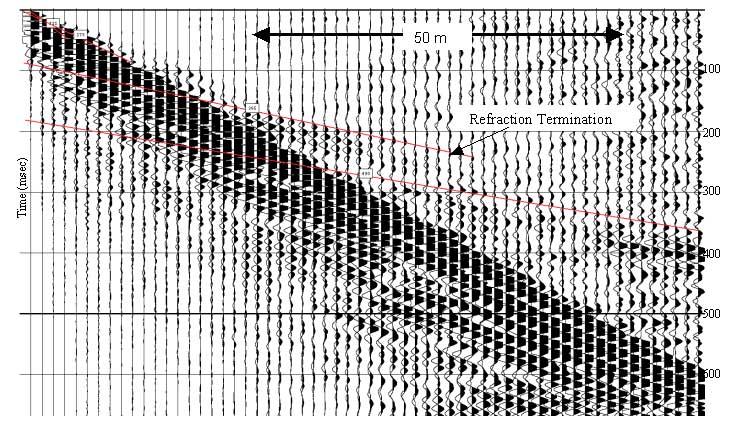
Figure 3. Common source point record from site CUET showing first arrival picks and refraction termination. Reflection data (not emphasized by different data processing in this figure) were used to calculate the thickness and velocity of the low-velocity zone between the two highest velocity refraction arrivals.
Summary of Observed Seismic Velocities
Velocities in the measured Vp and Vs profiles obtained in this study are generally similar to the 65 measurements recently completed by Williams and others (2003) in the Memphis area. Vs ranges from about 150 m/s in the upper 5 m to about 500 m/s over some intervals in the upper 60 m (Fig. 4). The Vs profile at MCAR in the Mississippi River floodplain is distinct from the others that are located on loess, which is also consistent with the results from Williams and others (2003). At MCAR, Vs increases more gradually than the other sites and does not exceed
Figure 4. P- and S-wave velocity-depth profiles for each of the six ANSS sites
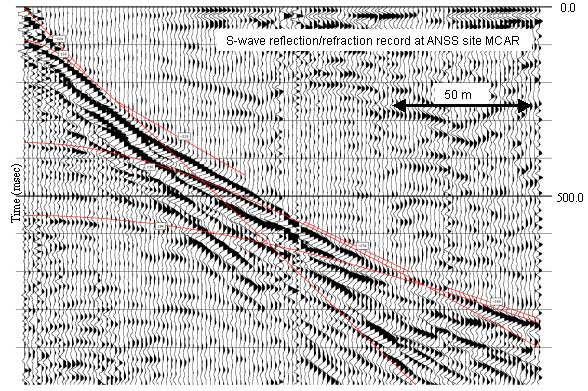
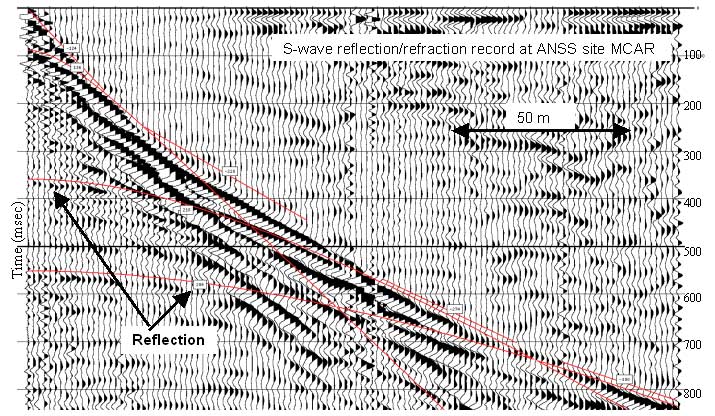
400 m/s (Fig. 4). This more gradual increase in Vs at MCAR is also reflected in this site having the lowest Vs30 (186 m/s). The Vs30 values for the other sites cover a narrow range from 230 m/s to 315 m/s (Table 2), which places all sites within NEHRP site category D. As described earlier, S-wave reflections were often used to help interpret the data. In terms of site response, the two-way, zero-offset travel time T of a reflection can be used to directly determine the frequency f of a potentially strong resonance by a simple quarter-wavelength calculation: f = 1/2T (Williams and others, 1999). Examples of these S-wave reflections and their corresponding resonance frequencies are shown in Figure 5.
P-wave velocity profiles for these sites are less variable than the Vs profiles, and generally start at about 300 m/s in the upper 3 m and then abruptly increase to about 1500 to 1700 m/s (a typical seismic velocity for saturated unconsolidated sediments) upon reaching what we interpret as the top of the water table (Fig. 4). For each site in this study, the top of the water table is the largest P-wave impedance boundary, with factors of 3 to 5 velocity increases occurring at this boundary (Fig. 4). This water table boundary forms a clear refraction arrival and usually a clear reflection (Fig. 6), and as in the case of the S-wave reflections, it suggests the possibility of strong resonances in the range of 5 Hz to about 20 Hz within this surficial layer (Table 2). Note that we conducted our study in May and that water table depths can fluctuate. Final results from all sites, including maps, site pictures, and data interpretations are given in Appendix.
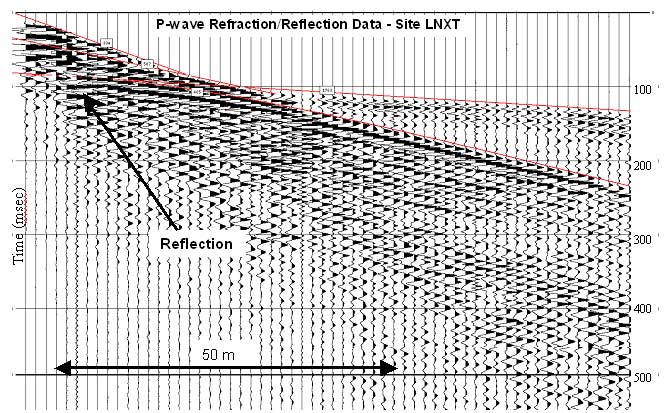
Figure 6. P-wave seismic reflection/refraction record from site LNXT showing a prominent reflection (and refraction), probably off the top of the water table, with a two-way travel time of 83 ms (17 m depth) that corresponds to a resonance frequency of 6.0 Hz using the quarter-wavelength calculation.
Acknowledgments
Mr. Chris McGoldrick and Mr. Russell Howie provided important field assistance to acquire the seismic velocity measurements. We are grateful to Dr. Mitch Withers who helped with site access. This study was funded by the National Earthquake Hazards Reduction Program (NEHRP) and was improved by a review from Charles Mueller. We also thank Phil Powers for help in making this online compatible.
References
Borcherdt, R. D. and Gibbs, J. F., 1976, Effects of local geological conditions in the San Francisco Bay region on ground motions and the intensities of the 1906 earthquake, Bull. Seism. Soc. Am., v. 66, 467-500.
Building Seismic Safety Council (BSSC) 1997, NEHRP recommended provisions for seismic regulations for new buildings, Part 1-Provisions (FEMA Federal Emergency Management Agency 302), 290 pp.
BSSC 2000. Proposals for Change to be included in the 2000 NEHRP Recommended Provisions, http://www.bssconline.org/provisions/.
Campbell, K. W., and Duke, C. M., 1976, Correlations among seismic velocity, depth and geology in the Los Angeles area, School of Engineering and Applied Science, UCLS, UCLA-ENG-7662, 54 pp.
Dobrin, M. B. 1976. Introduction to geophysical prospecting, McGraw-Hill Book Co., New York, 630 pp.
Hartzell, S., Leeds, A., Frankel, A., and Michael, J. 1996, Site response for urban Los Angeles using aftershocks of the Northridge earthquake, Bull. Seism. Soc. Am, v. 86 (1B), S168-S192.
Harris, J., Street, R., Kiefer, D., Allen, D., and Wang, Z., 1994, Modeling site response in the Paducah, Kentucky, area, Earthquake Spectra, v. 10, 519-538.
Mooney, H. M., 1984, Handbook of Geophysical Exploration, Volume 1, Seismic, Bison Instruments, Inc.
Saucier, R. T. 1974, Quaternary geology of the Lower Mississippi Valley, Arkansas Archeological Society, Archeological Research Series, No. 6, 26 pp.
Williams, R. A., Cranswick, E., King, K. W., Carver, D. L., and Worley, D.M., 1994, Site-response models from high-resolution seismic reflection and refraction data recorded in Santa Cruz, California, in The Loma Prieta, California, Earthquake of October 17, 1989-Strong Ground Motion, U.S. Geological Survey Professional Paper 1551-A, R. D. Borcherdt, ed., A217-242.
Williams, R. A., Stephenson, W. J., Frankel, A. D., and Odum, J.K. 1999, Surface seismic measurements of near-surface P- and S-wave seismic velocities at earthquake recording stations, Seattle, Washington, Earthquake Spectra, v 15, 565-584.
Williams, R.A., Wood, S., Stephenson, W.J., Odum, J.K., Meremonte, M.E., and R. Street, 2003, Surface seismic-refraction/reflection measurement determinations of potential site resonances and the areal uniformity of NEHRP site class D in Memphis, Tennessee: Earthquake Spectra, v. 19, 159-189.
Woolery, E., Street, R., Wang, Z., and J. Harris, 2000, NEHRP soil classifications and 1-D site effects in the upper Mississippi Embayment, Seismological Research Letters, v. 71, no. 1, p. 114.
APPENDIX – Detailed results from each site showing:
1) Photographs and maps of the site
2) Individual 1-second travel time “shot” gathers for P- and S-wave sources with the following information annotated on these plots:
a) filtering and gain processing parameters
b) zero-offset times of refraction/reflections at edge of profiles
c) red lines tracing the first-arrival refraction/reflection phases
d) refraction/reflection apparent velocities (in m/s) in outlined boxes
3) Listing of input/output data for refraction interpretation program
4) Summary listing and graph of P- and S-wave velocity model for each site along with general acquisition parameters
University of Memphis-CERI Site
Christian Brothers High School Site
Mid-South Community College Site
Crestview Middle School, Covington, TN
| AccessibilityFOIAPrivacyPolicies and Notices | |
| |
|