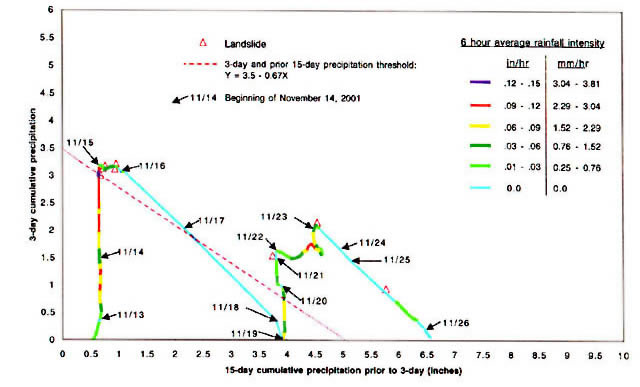
Figure 15. Cumulative
rainfall and rainfall intensity (color-coded line) in northeast Seattle
during the period November 13-26, 2001 in relation to landslide occurrence
(triangles) and 3-day and prior 15-day threshold (red line). Based
on hourly rainfall data from the City of Seattle rain gauge no. 2 (fig.
3).
|