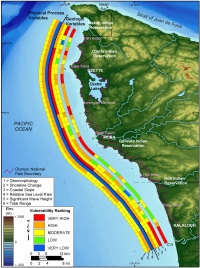
The data within the coastal vulnerability index (CVI) show variability at several spatial scales. However, the physical process variables maintain the most consistency over the extent of the park. The vulnerability of relative sea-level rise is very low over the length of the shoreline. The wave data are essentially high for the entire park except for two embayments south of Rialto Beach where wave heights are moderate because headlands provide a measure of protection from the dominant northwesterly winds. Tidal range vulnerability is moderate throughout the park.
Figure 12. Relative Coastal Vulnerability for Olympic National Park.
The geologic variables show the most variability and thus have the most influence on the relative coastal vulnerability. Geomorphology in the park includes very low vulnerability rocky cliffs, very high vulnerability sandy beaches, as well as intermediate vulnerability landform types. Shoreline position within the park is stable with all erosion/accretions rates falling between -1-+1 meter per year making the entire Olympic shoreline moderately vulnerable with respect to shoreline change. Regional coastal slope varies from moderate vulnerability in small areas in the southern portion of the park to high vulnerability near Shi Shi Beach and Ruby Beach to very high vulnerability in the central portion of the park from north of Ozette Lake to south of Rialto Beach (Figure 12). The single most influential variable in the CVI is geomorphology; therefore it can be considered the dominant factor controlling how the Olympic shoreline will evolve as sea level rises. The geomorphology variable controls CVI changes on small spatial scales (~ 5 km). However, variability within the coastal slope and significant wave height variables provide a larger-scale control (25-30 km) on the CVI value. This results in an overall higher vulnerability shoreline within the central and northern portion of the park.
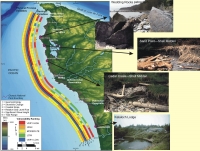
Figure 14. Location of selected cultural resources along the Olympic coast that may be affected by sea-level rise.
Some park resources could be threatened with the likelihood of accelerated sea-level rise. A few examples of cultural resources that could be impacted within Olympic National Park include petroglyphs carved into rocks along the shore, shell middens, and Kalaloch Lodge (Figure 14). With the exception of the petroglyphs, the cultural resources mentioned here are located within regions that have been classified as very high vulnerability.