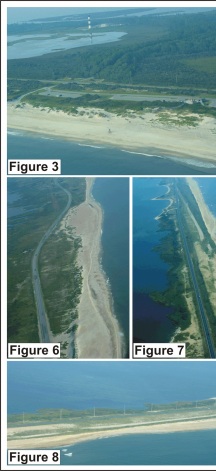
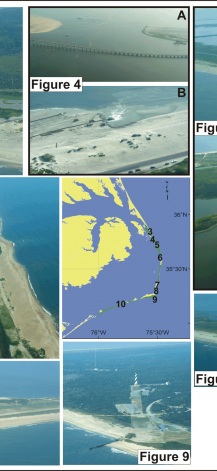
Figures 3-10. Figures 3-10: Photos taken along Cape Hatteras National Seashore in August 2003; the numbers on the inset location map correspond to the Figure numbers.
Figure 3: Coquina Beach with Bodie Island Lighthouse in the background. Coquina Beach is ranked as very high vulnerability based on geomorphology.
Figure 4: A) The Bonner Bridge crosses Oregon Inlet and connects Bodie Island to Pea Island National Wildlife Refuge (NWR). Dredging takes place frequently within Oregon Inlet to maintain a navigation channel. B) Sand dredged from Oregon Inlet is being pumped onto the beach within Pea Island NWR. Pea Island is ranked as a very high vulnerability area.
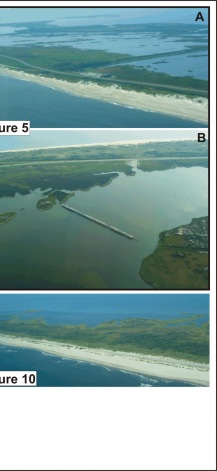
Figure 5: A) Vast wildlife habitat especially for shorebirds on the landward side of Pea Island NWR. B) The bridge that was constructed in the 1940's to bypass a breach that occurred across Pea Island during a hurricane.
Figure 6: Area just north of Rodanthe known as the S-curves. Road relocations caused by erosion hotspots have result in such turns in the road (very high vulnerability).
Figure 7: Road relocation between Avon and Buxton. The former location of the road is denoted by the break in vegetation. The barrier is so narrow that there is no room left to move the road landward (very high vulnerability).
Figure 8: Oblique view of the narrow part of the island shown in Figure 7. The NC Department of Transportation has planted dune-colonizing grass, which shows up in a gridded pattern (very high vulnerability).
Figure 9: The new location of Cape Hatteras Lighthouse. The old location was behind the groin in the foreground. The groin in the photo is one of three that were built to protect the lighthouse prior to its relocation in 1999-2000 (very high to high vulnerability).
Figure 10: Numerous overwashes have occurred on the eastern end of Ocracoke Island. Deposits from washover events are visible on the landward side of the island (very high vulnerability).
Click on each image for larger figure.
|