

Map of Coastal
Vulnerability
 |
Results
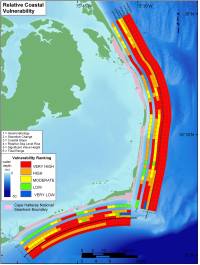 |
| Figure 13. Relative Coastal Vulnerability for Cape Hatteras National Seashore. Click on figure for larger image. |
The calculated CVI values for Cape Hatteras range from 18.26 to 51.03. The mean CVI value is 37.64; the mode is 45.64 and the median 36.5. The standard deviation is 7.54. The 25th, 50th, and 75th percentiles are 32.0, 36.0 and 42.0, respectively.
Figure 13 shows a map of the CVI (vulnerability ranges) for Cape Hatteras National Seashore. The CVI scores are divided into low, moderate, high, and very high-vulnerability categories based on the quartile ranges and visual inspection of the data. CVI values below 32.0 are assigned to the low vulnerability category. Values from 32.0 - 36.0 are considered moderate vulnerability. High-vulnerability values lie between 36.01 and 42.0.  |
| Figure 14. Percentage of CAHA shoreline in each vulnerability category. Click on figure for larger image. |
CVI values above 42.0 are classified as very high vulnerability. Figure 14 shows a histogram of the percentage of CAHA shoreline in each vulnerability category. Nearly 195 km (120 miles) of shoreline is evaluated along the Outer Banks. Of this total, 27 percent of the mapped shoreline is classified as being at very high vulnerability due to future sea-level rise. Another 27 percent is classified as high vulnerability, 30 percent as moderate vulnerability, and sixteen percent as low vulnerability.
|
|