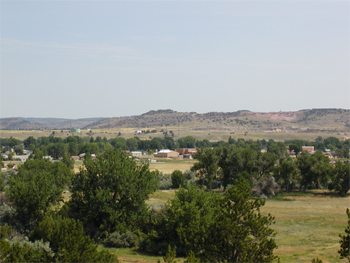
Results of Electrical Resistivity Data Collected near the Town of Guernsey, Platte County, Wyoming |
By Robert R. McDougal, Jared D. Abraham, and Robert J. Bisdorf |
| Open-File Report 2004–1095 |
 |
| Version 1.0 |
| Published 2004 |
| As part of a study to investigate subsurface geologic conditions as they relate to ground-water flow in an abandoned landfill near the town of Guernsey, Wyoming, geophysical direct current (DC) resistivity data were collected. Eight vertical resistivity soundings and eight horizontal resistivity profiles were made using single channel and multi-channel DC instruments. Data collected in the field were converted from apparent resistivity to inverted resistivity with depth using a numerical inversion of the data. Results of the inverted resistivity data are presented as horizontal profiles and as profiles derived from the combined horizontal profile and vertical sounding data. The data sets collected using the single-channel and multi-channel DC systems provided for the resistivity investigation to extend to greater depth. Similarity of the electrical properties of the bedrock formations made interpretation of the resistivity profiles more difficult. High resistivity anomalies seen in the profiles are interpreted as quartzite lenses and as limestone or metadolomite structures in the eastern part of the study area. Terrace gravels were mapped as resistive where dry and less resistive in the saturated zone. The DC resistivity methods used in this study illustrate that multi-electrode DC resistivity surveying and more traditional methodologies can be merged and used to efficiently map anomalies of hydrologic interest in geologically complex terrain. |
| The text of this report is presented here in Portable Document Format. The latest version of Adobe Acrobat Reader or similar software is required to view it. If you wish to download the latest version of Acrobat Reader free of charge, click here . |
It is best to download a large PDF file to your hard drive rather than open
it inside your browser. (A standard click may automatically open the PDF file
inside the browser but doing so will result in a very slow load.)
For guidance
on how to do this, go to [http://cpg.cr.usgs.gov/toolbox/download_advice.html].
Downloading the PDF file may take several moments but will be worth the wait. Once it is downloaded, open the PDF from your hard drive using Adobe Acrobat—it will open in a fraction of the time it would take to open the PDF over the Internet.
|
For viewing and printing. |
Text-only version of the report. |
| North-south trending resistivity profiles from combined SuperSting and vertical sounding data. Profiles are aligned to common UTM northing coordinates. Profile locations are shown in figure 2. |
All files used to produce the resistivity profiles in this report are included and listed by directory as follows: |
|
| Eight lines of resistivity data collected with the AGI SuperSting system. Each line directory includes: original .dat inverted resistivity data, Surfer v.8 plot files, .grd grid files, and .bln blanking files, and Excel spreadsheet of data and coordinates. | |
| Eight lines of combined resistivity data collected the AGI SuperSting system and ABEM single-channel system. Each line directory includes: original .dat inverted resistivity data, Surfer v.8 plot files, .grd grid files, and .bln blanking files, and Excel spreadsheet of data and coordinates. | |
| AccessibilityFOIAPrivacyPolicies and Notices | |
| |
|