Skip past header information USGS Logo with link to USGS Web page
Coastal Vulnerability Assessment of Cumberland Island National Seashore to
Sea-Level Rise, USGS Open-File Report 2004-1196


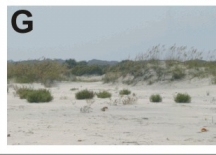
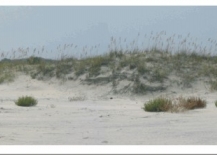
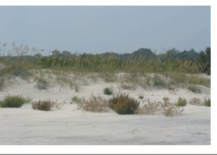
Figure 3G. Although the dunes are lower here than at location C and D, they are more stable and continuous.


Figure 3G. Although the dunes are lower here than at location C and D they are more stable and continuous. Figure 3G. Although the dunes are lower here than at location C and D they are more stable and continuous. Figure 3G. Although the dunes are lower here than at location C and D they are more stable and continuous.

Skip Footer Information [an error occurred while processing this directive]