 |
|
|
||||
by the National Streamflow Information Program Committee (J.D. Bales, J.E. Costa (chair), D.J. Holtschlag, K.J. Lanfear, S. Lipscomb, P.C. Milly, R. Viger, and D.M. Wolock)
U.S. Geological Survey Open File Rpeort 2004-1263--ONLINE ONLY
The report is available as a pdf.
The Committee that prepared this plan for a National Streamflow Information Program (NSIP) met and worked in 1998-1999. The results of the Committee�s meetings and deliberations are contained in this document, which is a product of the circumstances of the U.S. Geological Survey streamgaging program as of 1999. Over the next several years as partial funding for NSIP became available, parts of the plan presented here were adopted, other parts were revised, and some have never been implemented. Although this report was completed and reviewed in 1999, personnel changes, planning, and implementation of this important new program has delayed publication until now. A brief summary was published in 1999 (Streamflow Information for the Next Century, 1999, U.S. Geological Survey Open-File Report 99-456, 13 p.). The NSIP program today (2004) is similar but not identical to the program outlined herein. This report is published since it provides the only detailed documentation of the thinking and workings of the Committee who developed and designed the program. From a larger perspective, this report also serves to document the vision of the Water Reosurces Discipline for the future of streamgaging in the U.S. Geological Survey. A more recent description of NSIP is provided in Hirsch, R.M. and Norris, J.M., 2001, National Streamflow Information Program: Implementation Plan and Progress Report: U.S. Geological Survey Fact Sheet FS-048-01, and National Research Council, 2004, Assessing the National Streamflow Information Program: National Academy Press, Washington, D.C., 146 p.
The NSIP web page contains these reports, and others, as well as the most current information about NSIP. The web page can be found at http://water.usgs.gov/nsip/.
The Nation needs accurate and timely information about the movement of water through its network of streams. This information is needed to support many and broad purposes to:
Since 1889, the U.S. Geological Survey (USGS) has operated a multi-purpose streamgaging network supported primarily by other Federal, State, and local agencies. With the passage of the Clean Water Act, advent of the Internet, and continuing increases in flood damages, the demand for and value of streamflow information has grown, and information users have developed increased expectations for reliability and timeliness of the information. Moreover, there is an increased need for long-term, high-quality records and analysis of streamflow data to provide necessary information for natural-resource managers. In the last 30 years, the overall size of the USGS streamgaging program first leveled off and has since begun to decline (for example, fig. 1). Furthermore, the share of the streamgaging program supported by Federal funding has dropped disproportionately with consequent loss of representation of Federal interests in the siting of streamgages and reduced ability to meet Federal needs.
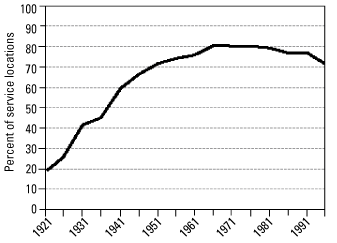
Figure 1. Percent of 1996 National Weather Service flood-forecast locations having active streamgaging stations, as function of year (U.S. Geological Survey, 1998).
To meet the many varied streamflow information needs of the Nation, the USGS will ensure the effective collection, processing, interpretation, and dissemination of streamflow information for Federal needs into the future through a comprehensive National Streamflow Information Program (NSIP). NSIP will consist of the following components, many of which are consistent with recent recommendations of the National Research Council (1991, 1999):
This report provides detailed information in support of the report �Streamflow Information for the Next Century�A Plan for the National Streamflow Information Program of the U.S. Geological Survey (U.S. Geological Survey, 1999). The aforementioned five elements of NSIP are described in detail in this report. The rationale for each element is provided, and desired features of each element are given in some detail. Major sections of this report are ordered to follow a logical sequence of :
Concise statements of important features of the NSIP design are shown in bold type throughout this report. The most important features of NSIP are summarized here to give an overview of the program.
Streamgaging Network:
Data Collection for Floods and Droughts:
Information Delivery, Data Processing, Quality Assurance, Archival, and Access:
Assessments of Streamflow Characteristics:
Development and Research:
The overall objective of the NSIP is to meet the Federal need for streamflow information, in cooperation with the needs of state and local customers. More specifically, in order to meet the Federal needs, NSIP will provide streamflow information that will have broad utility to the Nation�information that is needed for multiple purposes and by multiple parties, in contrast to information that will likely meet one particular purpose or serve the interests of a few parties. Among the parties that should be served by the NSIP are individual citizens, the private sector, local governments, State agencies, tribes, and Federal agencies. The goal of NSIP is to provide information that can be used for many decisions by many parties. Key attributes of NSIP include the following:
Two important points arise from the notion of Federal need. First, streamflow information from a specific site that has the potential to meet multiple purposes does not meet Federal needs unless the information is freely shared, readily accessible, archived, quality-assured, and viewed as neutral and high quality. Thus, any analysis of the streamgaging network from the perspective of Federal needs must consider these attributes. Streamgages that do not have all five of these attributes should not be considered as contributing to the Federal need unless modifications to data management and delivery can be made. Second, Federal agency needs are a subset�albeit an important subset�of the full suite of Federal needs.
Important examples of Federal needs include:
Some examples of Federal agency streamflow-information needs include the following:
Historically, Federal needs for streamflow information have been addressed in the streamgaging program through a variety of Federal funding mechanisms (Wahl and others, 1995). In 1994, 56 percent of streamgages were funded through the USGS Federal-State Cooperative Program (the Coop Program), under which the USGS provides up to half of the funding for any streamgage, with the balance paid by State or local agencies. The Federal cost share entitles USGS to a voice in the location of the streamgage, and this provides a mechanism for meeting Federal information needs. Streamgages are also fully funded directly by other Federal agencies, such as the USACOE and the BOR. In 1994, this funding by other Federal agencies accounted for 26 percent of streamgages. Approximately 8 percent of streamgages in 1994 (6 percent in 1998) were fully funded by the USGS, typically to support national programs of water-resource investigations or to satisfy legal mandates. The remaining 10 percent of streamgages were funded by some combination of these three mechanisms.
In response to a Congressional request, the USGS completed an evaluation of the ability of the streamgaging network to meet Federal needs for streamflow information (U.S. Geological Survey, 1998). The report defined several quantifiable measures of the degree to which a given national network of streamgages satisfied specific Federal information needs. Using these measures, the report determined the historical changes over time in the degree to which Federal information needs have been met. The evaluation focused on five key Federal objectives for streamflow information:
The report concluded �In most cases the level of attainment of the metrics, as measures of the goals, typically rose steadily [from 1921] through the 1960s or 1970s and then have either leveled off or declined. Some goals are now less well supported than in the 1950s and 1960s� (for example, fig. 1). This result can be traced to a similar pattern in the size of the streamgaging program, coupled with an increase in the number of streamgages funded primarily by State and local cooperators for a specific local need.
The declining responsiveness of the streamgaging program to Federal needs has been associated with a simultaneous drop in total USGS contributions to the overall program. As USGS contributions to the Coop Program decrease, fewer Federal needs are met by the streamgaging network. Direct financial support of streamgages by the USGS declined from 11 percent of the program in 1974 to less than 6 percent in 1998. Over the same period, the USGS match of State and local funding through the Coop Program decreased from a level higher than 99 percent (almost one USGS dollar for each State/local dollar) to a 1998 level of 87 percent. The fraction of overall contributions from other Federal agencies did increase from 25 to 28 percent during this period, but not enough to counter the loss in USGS funding. Overall, the State and local contributions rose from 33 percent of the total in 1974 to 40 percent in 1998 (fig. 2).
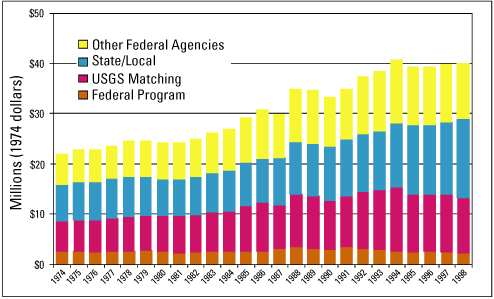
Figure 2. Sources of funding for the streamgaging program, 1974-1998 (U.S. Geological Survey, 1998).
In the analysis performed in response to the Congressional request, the definition of the performance measures was held constant over the period of the network evaluation. In fact, the needs for water information steadily increased over the period of analysis, following growing concerns for water quality, aquatic and riparian habitat, and recreation. If the results could be adjusted for the growth in information needs, then flow data would show more marked general decline in performance during the recent decades. All of this is occurring despite technological advances (widespread use of satellite telemetry and access to the World-Wide Web), which markedly increase the value of streamgages by allowing routine dissemination of real-time data.
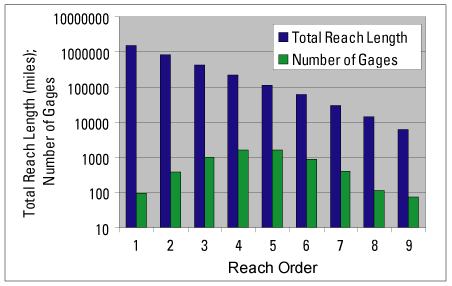
The multi-scale structure of the stream network guides and constrains the development of a national streamflow information program. Flows from the smallest channels (first-order streams) combine to supply second-order streams, and so on (Strahler, 1952). Using the simple principle of geometric similarity across a wide range of scales, Leopold (1962) derived estimates of numbers, lengths, and drainage areas of stream reaches of various orders in the United States (U.S.). Leopold estimated that there were about 2 million stream reaches in the U.S., including almost 1.6 million first-order reaches that drain basins that are on the order of 1 mi2.
Over time, a successively refined system for classifying basins and streams has evolved (Table 1). Initially, the U.S. Water Resources Council (1968) defined water-resources regions and subregions. Subsequently, the USGS defined two levels of subdivisions within subregions, called accounting units and cataloging units (fig. 3) (Seaber and others, 1987). In order to facilitate the management of information on smaller hydrologic units, the U.S. Department of Agriculture Natural Resources Conservation Service (NRCS) has introduced two further levels of subdivisions, termed watersheds and subwatersheds. This system constitutes a consistent framework for describing drainage basins over a wide range of scales.
| Hydrologic Unit | Number of Units | Typical Drainage Area (mi2) | Typical Reach Length (mi) |
|---|---|---|---|
| Region | 21 | 140,000 | 600 |
| Subregion | 222 | 14,000 | 200 |
| Accounting Unit | 352 | 7,800 | 140 |
| Cataloging Unit | 2149 | 1,200 | 50 |
| Watershed | 20,000 | 150 | 17 |
| Subwatershed | 100,000 | 30 | 7 |
| RF1 Reach Area | 68,000 | 50 | 10 |
| RF2 Reach Area | 170,000 | 15 | 5 |
| RF3 Reach Area | 3,200,000 | 1 | 1 |
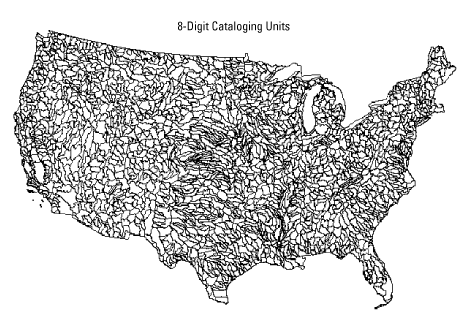
Figure 3. Conterminous United States subdivided into cataloging units.
A distinct, but complementary, approach has been taken by the USEPA, which has developed successively refined databases (�Reach Files�) of stream reaches. The most recent and most detailed database, Reach File Version 3.0 Alpha Release (RF3-Alpha), includes 3.2 million river reaches, and effectively resolves the national stream network down to first-order streams.
The general nature of a national streamgaging program can be predicted from the structure of the stream network. Given limited financial resources, the structure of the drainage network suggests that a comprehensive, national streamgaging program will be based on a two-scale strategic framework, with large basins gaged extensively and small basins gaged selectively. Extensive streamgaging of larger basins is justified by the relatively small number of such basins and by the fact that large basins collect flow from the smaller basins. It is reasonable to streamgage flows from all accounting units (352 basins), and perhaps even from all cataloging units (2,149 basins). On the other hand, it is clearly impossible to streamgage flows from smaller units (e.g., watersheds) exhaustively. Information needs will dictate the balance of streamgaging efforts between large and small basin sizes, which, in turn, will determine the smallest scale that is extensively gaged. In 1996, streamgage density was approximately constant at one streamgage per 100 stream miles for reach orders of 5 or greater (fig. 4).
Small basins chosen for streamgaging should be those for which streamflow information needs are considered greatest, including the ability to transfer data from gaged to ungaged basins. Hence, local basin information needs, as well as the extent to which the basin is representative of other small basins should be considering in the placement of streamgages in smaller basins. Presently, information transfer across small reaches is ordinarily attempted only for streamflow characteristics (Section 8), and not for actual flow time series. However, the application of streamflow modeling tools may eventually lead to the latter type of information transfer, as suggested in Section 8.4.
The characterization of smaller-scale basins can also be aided efficiently by the use of short-term measurements for large numbers of small basins. Such practices have often been used for USGS streamflow information gathering. NSIP programs for data collection during critical events are described in Section 4.
This section provides a quantitative definition of Federal needs for streamflow information that should be supplied by a national streamgaging network. �Base� information needs are those that should be met by the USGS streamgaging program even in the absence of support from funding partners. There is no truly objective means to determine such fundamental Federal requirements or needs for streamgaging; any list is equivocal. The list advanced here is based on perceptions of the most compelling demands at the national level. These include legal mandates of the Federal government, protection of lives and property, and an overarching need for general streamflow information to address surface-water resource and quality issues at regional and national scales.
Base needs for streamgaging information include stream locations associated with existing compacts and decrees, existing NWS flood-forecast sites, accounting-unit water budgets, regionalization and trends, and water quality. These information needs are described briefly below; more precise descriptions are given in Appendix A (Section 11). The number in parenthesis with each bullet heading below is the estimated number of sites, basins, or reaches for which a continuous, streamgage-based record is required. Any one of these information goals may be met by a single streamgage or by a combination of streamgages, and any single streamgage may support one or more of these information goals. In general, however, these numbers are approximately equal to the number of required streamgages.
Table 2 summarizes base streamgaging needs, the number of streamgages required to satisfy each need, and the 1996 status of the network relative to each need. For example, of the 700 streamgages needed to support identified water-quality needs, 380 (or 54 percent) were in place. Overall, 61 percent the streamgages needed to meet identified Federal needs were in place in 1996. (The levels of attainment were calculated using network analysis tools described in Appendix A, Section 11.) Overall, 3,326 information goals (60 percent of 5,280) were net by the 1996 network.
| Streamgaging Need | Number of Streamgages Required to Satisfy Need | Percentage of Required Streamgages in Operation (1996) | Number of Additional Streamgages Required to Meet Identified Need |
|---|---|---|---|
| Compacts and Decrees | 350 | 56 | 160 |
| Current NWS Flood-Forecast Sites | 3,100 | 73 | 1,100 |
| Accounting Unit Water Budgets | 330 | 77 | 150 |
| Regionalization and Trends | 800 | 76 | 350 |
| Water Quality | 700 | 88 | 320 |
| TOTAL | 5,280 | 2,080 |
The number of required streamgaging stations in this report does not exactly match the number of required streamgaging stations for the same Federal goals in the 1998 Report to Congress (U.S. Geological Survey, 1998). This occurs because of adjustments to the way a streamgage or streamgages can satisfy a Federal goal, refinement of the criteria to satisfy a goal, and rounding.
It must be emphasized that the full range of Federal streamflow information needs is not included in this list of base needs. Other important Federal needs include:
Streamflow information for these purposes may be more appropriately obtained under cooperative funding agreements, wherein partners share the marginal costs of streamgage operation, as described in Section 2.6.
The base needs presented in table 2 represent a trade-off between the full range of needs viewed as important by many scientists and water-resources managers, and the set of needs that can be satisfied with a reasonable number of streamgaging stations. It is important to realize that the set of base needs represents a minimum, and not an upper limit, for the streamgages that should receive some degree of Federal support. Review and comment on this definition of base needs will be sought from stakeholders and from the National Research Council.
Nationwide, the USGS operated 6,593 streamgages in 1996 (table 3). The number of streamgages directly supporting identified base Federal goals (2,331) is smaller than the number of base Federal goals being met by the network (3,180). This difference is explained by the fact that some streamgages satisfy more than one base Federal goal.
| Characteristic | Number of streamgages in 1996 network |
|---|---|
| Stations that support identified base Federal needs | 2,331 |
| Stations that redundantly support identified base Federal needs | 1,432 |
| Stations that support Federal goals other than identified base needs | 2,830 |
| Total active stations | 6,593 |
Based on data available in 2000, it appears that full attainment of the base Federal goals could be achieved by re-activating about 900 streamgages that have been operated in the past and by adding about 1,100 new streamgages. These 2,000 new streamgaging stations, along with the 2,300 existing stations that support the identified base Federal streamgaging needs, gives an estimated need for 4,300 stations. These numbers are tentative and do not reflect the existence of streamgages operated by other agencies that could, at low cost, be modified to satisfy the requirements of a base Federal station. Final determination of the number and placement of these re-activated and new streamgages is a costly process involving substantial staff time by the USGS and by many other agencies who are data users and/or funding partners. For now, these numbers represent planning estimates that will likely be refined through an extensive process of consultation. The planning process would generally follow the methods demonstrated in this report.
As indicated in the previous section, satisfaction of minimal Federal needs for streamgaging will require expansion of the streamgaging network and increased Federal funding of the streamgaging program. This section describes possible features of a mechanism for funding growth of the streamgaging network. Several issues were considered in the design of the proposed funding mechanism:
To ensure the future effectiveness of the program, it is proposed that the fixed (or indirect) cost of the USGS streamgaging program will be estimated, and this cost will be paid by Federal appropriation. In 1998, approximately 6,900 streamgages, with an average program cost of about $10,000 per streamgage, resulted in a total program cost of 69 million dollars ($M). A detailed budget analysis will be required to determine the fraction of this amount that reflects fixed costs, but they are on the order of 40 - 50 percent of the total cost. At the same time, the marginal (or direct) cost per streamgage will be determined, and this amount will comprise the maximum amount paid by Federal, State, and local partners.
Fixed costs are those expenses required to maintain and enhance a national capability to streamgage streams and store and disseminate streamflow data, regardless of the size of the program. These are the �overhead� costs of the streamgaging program, which include computer hardware and software, communication systems, equipment testing, data-management staff, research and development associated with streamgaging operations, management and supervision, quality control and assessment, and regional and national analysis.
The direct costs are those costs that depend directly on the number of streamgages in the program. They include the hydrographer�s field and office time to service the streamgaging station, to make discharge measurements, and process, compute, and publish the record, the streamgaging equipment, and travel expenses for streamgage site visits.
In the proposed cost-sharing arrangement for all streamgages in the network, Federal partners would pay only the direct cost per streamgage. The cost to a State or local agency may be reduced further using matching money in the Coop Program. As in the current policy, matching money would be used only for streamgages that satisfy some Federal interest. The level of Federal interest and the amount of matching money would be determined by District management.
The second major feature of the proposed funding mechanism is full Federal funding of costs of streamgages to satisfy the base Federal streamflow information needs. The network analysis tool used in Section 2.4 would be used to generate a hypothetical national network of streamgages sufficient to meet the prescribed base needs. The distribution of these streamgages among Districts would determine the target distribution of funding. The actual distribution of funding would differ from the target, due to insufficiency of funds as the program is phased in. Funding would also be adjusted, if necessary, due to prolonged failure of a given District�s program to meet the Federal needs at a level commensurate with the level of funding.
A rough estimate of the cost (in current dollars) of expanding the streamgaging network can be made, if it is assumed that:
Therefore, new funding for streamgages to meet base Federal goals and under to proposed funding scenario would be on the order of $48M ({$35M + $21M + $14M} - $22M = $48M).
Whereas the U.S. Geological Survey operates the largest number of streamgaging stations, we recognize that other local, State, and Federal organizations also streamgage streamflow. (Although not necessarily in the same manner, or with the same equipment). The USGS publishes much of the data that are collected and processed by others, as long as the data quality control at least matches ours. These non-USGS streamgaging stations need to be included in the network analysis tool database. It is likely that some existing non-USGS streamgaging stations could be enhanced (for example, with real-time telemetry) and meet one or more of the defined base Federal streamgaging goals. Modifying non-USGS streamgages could result in lower costs than building a new Federal station. This information is now being compiled, and will be incorporated into the network analysis tool in the near future.
Given the magnitude of program costs, practical implementation of these initiatives requires a realistic approach to transition from the current cost and funding system. One approach to phasing in the Federal coverage of fixed costs is to have a Federal appropriation for fixed costs that grows from zero to full fixed costs over a period of several years. The amount charged to customers per streamgage would decrease accordingly over time from the total per-streamgage program cost to the direct cost. Simultaneously, the funds for costs of streamgaging to meet base Federal information needs could be phased in over time. Such funds would be made available only to the extent that they were used for meeting the identified base Federal information needs. The phase-in of resources for streamgages supporting base Federal goals would encourage partners to place streamgages at locations supporting Federal needs because of lower costs to them.
The Coop Program has proven to be a major source of funding for the streamgaging network in the past. History has shown, however, that the Coop Program does not provide an appropriate level of stability to support the base Federal program, or to support the interpretation of streamflow data at regional and national scales. Periodic budget pressures and changes in local priorities create a volatility that is not acceptable for a national program. Continuity of data is essential for resource and environmental monitoring programs and for hazard warning. The Coop Program is an ideal mechanism to encourage States and localities that wish to go beyond the minimal effort by providing the Federal cost share to insure that the data are available, and that the data also meet Federal needs as well as State and local needs.
It should be added that the network analysis tool would be used centrally only to define the distribution of funding and to verify that the Federal needs are being met. The design of the actual network to meet the Federal goals should be left to the Districts, working in collaboration with the data users and funding partners. The Districts would be provided with the network analysis tools in order to assist them in designing a District streamgaging program that is responsive to Federal needs and those of cooperators.
Evaluation of the streamgaging network has always been an ongoing process. As history has shown, information needs change over time, and the network changes in response. Accordingly, individual streamgages will have varying lifetimes. For example, a streamgaging station operated as part of the Hydrological Benchmark program may be in operation for a century or more if the near-pristine nature of the basin is intact and baseline data on natural systems are valued. Alternatively, a streamgaging station that supports regionalization might be moved to a new site when streamflow characteristics have been determined with sufficient accuracy. The number and distribution of streamgages in support of NWS flood forecasting may change as technological developments occur in flood forecast methods, such as the incorporation of radar rainfall data into new models. Through regional or national meetings between USGS staff and data users, goals will need to be reassessed periodically. In time, the regionalization objective should be changed from its current simplistic form to one that is based directly upon estimation errors in regional relations for flow characteristics.
Another reason for periodic reassessment of the streamgaging network is the evolution of evaluation methodologies. For example, the quantitative analysis presented in earlier parts of this section (and the similar analysis in the Report to Congress) were made possible only by the recent development of the GIS-based network analysis tool described in Appendix A (Section 11). It is now reasonable to envision rapid growth of the geospatial information infrastructure for surface-water analyses. Such growth would lead directly to new opportunities to evaluate and optimize streamgaging networks at both District and national levels. To enable network-analysis applications, it is critical that streamgaging station metadata (operating agency, funding agencies, costs, purpose(s) of station, as well as accurate geographic coordinates) be readily accessible through the geospatial framework. Existing and future network analysis tools should be made available to all District offices to help with planning and optimization of streamgaging operations within their borders, and will be available on the Internet for all interested users. These metadata should include both non-USGS and USGS streamgaging data. It is anticipated that free access to the network analysis tools will stimulate their further development and provide another vehicle for District involvement in the rational evolution of goals used in the network evaluations.
The USGS will report to Congress every year on the state and effectiveness of the streamgaging program. It is envisioned that this report will include the following:
NSIP will include a program to modernize existing streamgages in the Federal network and to raise the standards for new streamgages in the Federal network. Where possible, streamgages that are not part of the Federal network should be constructed and instrumented in the same manner as the Federal network streamgages. Federal funding would be provided for enhancements to streamgages in the Federal network; enhancements to other streamgages could be cost shared. The enhancements outlined here will significantly increase the value of USGS streamgages. Most recommendations are within the reach of present technology, although some potential future enhancements are also discussed. Some specific technologies are identified, and optimal strategies to achieve the enhancement will vary with setting and will evolve over time. Also recommended elsewhere is a continuation of efforts to develop frontier technologies for streamflow measurement. The general approach of NSIP to enhancement of streamgages is to build upon existing successful practices. In particular, regardless of the technology available in the foreseeable future, it is important that the hydrographer continue to make field visits every 6-8 weeks to all streamgages.
Presently (1998), about two thirds of USGS-operated streamgages have real-time telemetry capability. In view of the recent trends in providing telemetry and in increasing demands for real-time information, every USGS streamgage will be equipped to enable real-time data dissemination by the USGS. The most common telemetry currently used is one-way (data-collection platform to USGS office) satellite telemetry. Two-way telemetry, however, is possible through radios, cellular phones, and two-way satellite-cellular technology. Two-way telemetry allows personnel to enable/disable, query, and control field equipment. For example, two-way telemetry can be used to change the data-collection interval, to provide a data transmission at a time other than the specified transmission interval, and to collect water samples in response to flow conditions. As new technology comes on line, costs decline, and existing telemetry becomes obsolete, one-way telemetry should be replaced by two-way telemetry.
The USGS has a large investment in infrastructure for field storage of data from stage sensors, data transmission from field to office, database storage, and data dissemination. Through NSIP, substantial enhancements of this infrastructure will be achieved. Furthermore, USGS personnel spend a large amount of time traveling to streamgages for maintenance and direct discharge (streamflow) measurement. In view of these considerable investments for streamgaging, it is important to consider how personnel and infrastructure may perform similar needed functions at relatively low additional cost for measurements of other environmental variables. Installation of new sensors should be considered for situations in which a new sensor might be added at a streamgage to provide environmental information of importance to Federal needs. Any sensor that can normally function without maintenance for 6-8 weeks (the typical period between visits by the hydrographer) would be expected to have reasonable maintenance costs. In addition to field maintenance, other costs would be incurred in purchasing the sensor and in processing the data, which for some data types could be equivalent to processing streamflow data.
The USGS will, over time, initiate continuous monitoring of streamwater temperature, air temperature, and precipitation at many streamgage sites. Streamwater temperature is an important control on numerous hydrologic (Constantz, 1998), chemical, and biological processes, and is a determinant of water quality and physical habitat. Water temperature measurement would also increase the accuracy of streamflow estimates produced under conditions of river icing and assist in the assessment of ice-jam flooding. Precipitation measurements are important for direct quantification of basin water input. The Federal (NWS) approach to precipitation estimation for the foreseeable future will be built upon a merging of point precipitation and Doppler radar measurements. Availability of hundreds to thousands of well-serviced precipitation stations would be of great advantage to NWS, whose partnership will be sought in implementation of the program. Precipitation gages cannot be co-located at all streamgages because of the siting requirements (open canopy, no splash from traffic on bridges, etc.) Air temperature is another easily measured environmental variable of importance for numerous environmental processes; again, a program for air temperature measurement should be designed in collaboration with the NWS.
The USGS should experiment with water-quality sensors as their reliability and cost approach acceptable levels. Water pH, specific conductance, and soil moisture can be measured reliably using existing instrumentation. Dissolved-oxygen sensors are reliable when serviced on weekly to monthly intervals. Ion-specific electrodes also currently exist, but most of these sensors do not have adequate resolution for environmental measurements. Fiber optics hold promise for measuring a wide range of water-quality constituents, and automated bacterial samplers and analyzers are in use in Europe.
The USGS currently has a multi-purpose streamgage network that was not specifically designed for flood warning, although providing real-time flood hazards . information is one of the foremost purposes of the USGS streamgaging network. At the very time when a streamgage is providing some of the most valuable data, however, the streamgage is at its greatest risk of failure. On average, 14 active USGS streamgages per year experience a 500-year or greater flood. Of these 14 sites, 6 on average are NWS flood-forecast locations. Any loss or interruption of the normal data stream from a streamgage constitutes a failure. The failure of a streamgage results in loss of critical information, with potential for consequent loss of life and property, as well as loss of important data needed for flood-frequency analysis.
Any loss or interruption of the normal data stream from a streamgage constitutes a failure. Floods can cause streamgage failure by physical damage or removal of components by flowing water or by water-borne debris, or by inundation of water-sensitive instrumentation. The most common flood-related causes of data loss are sensor failures, including lost orifice lines, plugged intakes and stilling wells, and water damage to recorders.
To ensure that Federal needs are met, all existing streamgages in the Federal network will be upgraded to withstand failure under conditions of the estimated 200-year flood, and all new streamgages in the Federal network will be built to withstand the 200-year flood. Approaches for meeting this requirement will vary from site to site. In many cases, however, it appears that the most cost-effective flood proofing may be accomplished by installation of recently developed non-contact stage sensors based on laser technology. These instruments can be positioned at an oblique angle above the water surface, which would permit the placement of sensors, recorders, and telemetry equipment safely out of reach of potentially damaging flood flows. Field-testing and subsequent large-scale deployment of non-contact stage sensors should begin immediately, with the goal of replacing as many contact (floats, pressure transducers, etc.) stage-sensing devices as practical. In some cases, substantial flood proofing may be achieved by elevating instrument shelters above the 200-year flood level, although this would also need to be accompanied by hardening of sensors and connecting lines.
The need for backup stage sensors and data transmission systems will be considered on a case by case basis at each streamgage in the Federal network. The need for backup systems is a function of the reliability of the primary system. Backup systems may be part of the plan for ensuring streamgage survival of the 200-year flood. The goal of NSIP, however, is to maintain a stream-to-Internet data-delivery reliability of 99 percent.
Rating curves for all streamgages in the Federal network will be extended out to the 200-year flood level using best available techniques. Generally, this will entail the development of theoretical rating curves derived from rigorous hydraulic surveys and modeling. Stage-dependent uncertainty in the rating curve will be quantified, and the history of shifts in the rating curve will be documented. This will provide useful information on the history of geomorphic changes in the stream environment.
,b>Every streamgaging station in the Federal network will have a surveyed cross section, encompassing the stream channel, valley floor, and hillslopes. The cross-section survey will include digital photographs of the site to document vegetation and landscape conditions. The location of every USGS streamgaging station (both streamgaging station structure and discharge measurement section) will be determined to an accuracy of 2 m using Global Positioning System (GPS) technology, so that station locations can be accurately matched to features on high-resolution maps and aerial photos.
Those locations that experience channel or floodplain instability or periodic large-scale flooding will be considered for inclusion in the international Vigil Network (Osterkamp and Emmett, 1992). The Vigil Network is intended for observation and documentation of long-term (multi-decade) landscape changes. At appropriate sites, the cross sections will be re-surveyed following events that induce substantial geomorphic change.
Routine monitoring of streamflow at streamgages provides measurements that are extensive in time, but limited in space. The characterization of floods and droughts, which are limited in time but typically extensive in space, can be vastly improved by supplementing routine streamgage records with short-duration, synoptic data collection programs throughout the affected region. The NSIP response to floods and droughts will be to supplement routine streamflow records with systematic field surveys throughout the affected area. These data, along with streamgage records will not only document the magnitude and extent of the event, but will also be used in the NSIP program of streamflow assessments.
Each flood and drought is unique, but a standardized approach to field work and data collection should ensure that important aspects of each event are recorded. Recommended data-collection responses to major floods and droughts are outlined in this section.
Scientists and technicians across the USGS will be identified as potential members of Flood Response Teams that will assist Districts in the standard response to floods. As soon as conditions of a major flood are evident, a federally funded Flood Response Team will be formed from the pool of potential members. Collectively, team members will be experienced in flood discharge measurements, indirect streamflow measurements, water-quality, sediment transport and geomorphology, and riparian habitat assessment. At least three national flood-equipment repositories should be formed for use by Flood Response Teams. The repositories will be supplied and maintained with equipment to supplement local office gear, including such items as boats, surveying and GPS equipment, current meters, and water-quality samplers.
The primary effort during floods will be to measure discharge at a large number of widely dispersed gaged and ungaged sites. In addition, high-water marks will be identified at as many sites as possible to document the maximum elevation of the flood and to provide information necessary for subsequent indirect estimates of peak flow. Aerial photography will be used as soon as conditions permit to locate sites for subsequent measurements and detailed investigation, and to document locations of channel avulsion, sediment deposits, and erosion. Templates of standard contracts for aerial photography, allowing specification of scale, coverage, overlap, and delivery times will be prepared and made available to all District offices to expedite aerial photography.
Flood Response Teams should include one person with clearance to acquire and work with Imagery Derived Products (IDPs), made from classified remote sensing data. For example, high-water marks provided from IDPs were used to compute an indirect discharge measurement on the Guadalupe River at Victoria, Texas, following floods in 1996 that inundated a 3-mi wide floodplain. The IDP images saved substantial amounts of labor in the field.
With the support of the Flood Response Team and following the guidelines of the USGS National Flood Plan, a systematic set of measurements will be made, including:
Current estimates of regional low-flow recurrence intervals are inadequate. As demonstrated during the 1999 drought in the eastern U.S., however, low-flow information is critical for water-supply allocation, maintenance of water-quality conditions, and protection of aquatic habitat. Droughts typically begin in a small area, and slowly increase in severity and areal extent over time. Droughts are readily characterized by direct discharge measurements made over the entire affected region. Accordingly, NSIP will conduct direct measurements of discharge at a large number of widely dispersed sites in the affected area during periods of extended drought (significant fractions of streamgages experiencing streamflow below 7-day 2-year low flows).
Selected water-quality samples (temperature, conductivity, dissolved oxygen, pH, and nutrients should be collected to monitor the water-quality characteristics of streamflow throughout a drought, which may require diurnal sampling. The aerial extent of a drought can be displayed on a map of the U.S. using real-time data from long-term streamgaging stations that are color-coded to current flow conditions by percentile [see http://water.usgs.gov/cgi-bin/waterwatch?state=us&map_type=dryw&web_type=map].
In coordination with the Office of Ground Water, water levels in unmonitored wells in unconfined aquifers will be measured. Measurements will be repeated if more severe drought conditions (substantial areas below 10-year low flows) arise. The need for additional measurements will be re-assessed in light of information from regional assessments of streamflow characteristics. Where large errors are present in regional drought relations, consideration will be given to making further measurements.
Both the USGS and the NWS currently support a network of observers across the Nation. Moreover, numerous community-based watershed organizations throughout the Nation are active in volunteer monitoring and observational activities. To assist in the extensive data-gathering activities for critical hydrologic events, a network of volunteer Water Watchers will be mobilized in cooperation with local watershed organizations. Flood-related activities might include flood-level observations and documentation, high-water mark preservation or even post-event surveying. Volunteers could assist in diurnal water-quality sampling during droughts. Training could be provided through a USGS-designed curriculum, to include complete safety instruction, possibly presented through the Water Resources Institutes. In addition to extending the scope of USGS data collection activities, the Water Watcher program would serve to build community awareness of USGS activities.
Recent advances in computing, telecommunications, and Internet-based information access are changing procedures for processing and delivering streamflow data within the USGS. Most important among these changes is the public availability of real-time streamflow data from most USGS streamgaging stations. This availability has created substantial new interest in the products of the USGS and presented new challenges for real-time streamflow data processing. A change in data processing procedures is needed to provide accurate historical and real-time data of known precision within minutes of measurement to a broad customer base. The Database System summarized in this section, with additional detail provided in Appendix B, is for temporal information; it is not focused on spatial information. NSIP Internet page interfaces, however, will integrate both temporal and spatial information.
A decade or more ago, network design, database systems, and delivery mechanisms were generally designed around the notion of mean daily value of discharge as the basic data product from a streamgaging station. Under NSIP, this will change, and efforts will be focused on serving continuous time series of stage and discharge at the collection interval (known as �unit-values�), typically 15 minutes or less. Accordingly, database software and hardware will be enhanced to support routine delivery of all data�historical and current�at the temporal resolution of measurement (�unit-values�). Time series data in this format will meet the needs of a growing number of customers for a variety of purposes.
The report �WRD Real-Time Data Delivery System�Problems and Improvement Opportunities� was prepared in December 1998 by the Water Resources Discipline (WRD) Computer Policy Advisory Committee (CPAC). The report notes that �our real-time data delivery system . . . was never designed to meet 24-hour per day, 365-days per year demand, much less �within minutes� and �near perfect reliability� expectations.� The CPAC report clearly identifies the important issues and deficiencies in the current system, and outlines a logical path for addressing the deficiencies. The report is a very useful supplement to the material in this section, and contains detailed discussions of a variety of human resources and technological issues associated with real-time data delivery.
Under NSIP, the database and software systems for receiving and processing streamflow data will move from District-based computers to a centralized multi-server system that takes advantage of the Internet to provide high reliability and economy of scale. In this system, data collection and review can occur at locations remote from the locations used for data storage and access. The configuration of the centralized system will be determined from a detailed analysis of network, equipment, and maintenance costs. The actual connections among the computers in the centralized system will be transparent to those entering, updating, and using the data.
The Database System will contain separate components, one each for data collection, review, routing, archiving, and access. The functions of data collection and review will be performed at Data Processing Centers, whereas archiving and access functions will be centralized at Data Access Centers, which deliver streamflow information to the public through associated Internet interfaces. A hypothetical configuration of the NSIP Database System (fig. 5) includes eight Data Processing Centers separately located from four Data Access Centers. Data from any streamgage can be processed at any Data Processing Center. Similarly, data from any Data Processing Center can be routed, archived, and accessed by any of the Data Access Centers. Each Data Access Center has nationally complete sets of streamflow information.
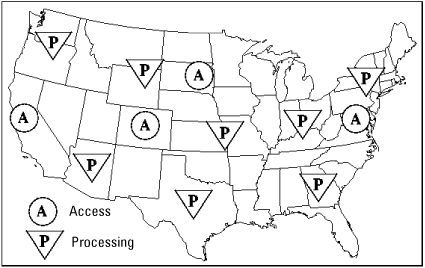
Figure 5. A hypothetical configuration of the NSIP Database System. The figure shows eight Data Processing Centers where real-time streamflow data are collected and reviewed, and four Data Access Centers where data are archived and accessed.
The separate system components (data collection, review, routing, archiving, and access) are required for the reliable and rapid movement of streamflow information from the data collection platforms to the public via the Internet. The most effective design for an individual database and software system component depends on the intended use of the system. A data routing system hub, for example, requires a different database design and software than a data archiving system. In addition, the differentiation of tasks isolates data processing from public access, which can be critical during floods and droughts, when USGS data collection and processing resources are stressed while public demand for streamflow information simultaneously increases.
Components of the Database System will be centralized as much as possible to reduce costs of maintenance. Fewer computers, databases and related software installations obviously require fewer human and financial resources to administer.
Each Data Processing Center will (1) receive a constant feed of data transmissions from data collection platforms, (2) convert the transmitted stage data into streamflow values, (3) perform quality control of the stage and streamflow data, and (4) estimate the amount of uncertainty in the stage and streamflow values. Hydrographers in District offices will be the primary users of the processing database and software, which they will access through Internet pages; the processing databases generally will be unavailable to other users.
Stage and discharge are measured with some uncertainty, and the rating curve is constructed with uncertainty. These sources of uncertainty affect how shifts in the rating curve are applied, and they determine the confidence limits of the stage and streamflow data. In NSIP, statistical methods of uncertainty analysis will be used for quality control, construction of rating curves, determination of rating-curve shift applications when to apply shifts, and quantification of confidence limits on stage and streamflow data. Quality assurance techniques assess the uncertainties in stage measurements, direct discharge measurements, and rating curves to ensure the accuracy and to quantify the uncertainty of streamflow information. In NSIP, these analyses will be performed in four phases corresponding to the timings of data availability. (See Appendix C in Section 13.)
The data routing, archiving and real-time public access components of the database system will be located at several Data Access Centers (fig. 5). Each Data Access Center will have the same set of databases, software, and functionality. The Data Access Centers are intentionally located away from the Data Processing Centers, in order to shield the Data Processing Centers from Internet traffic at the Data Access Centers.
The data routing components will receive data from the Data Processing Centers in real-time and transmit data to the Data Access Centers. The routing system also will be responsible for adding new sets of finalized data to the data archival system and will manage the transmission of streamflow information through the Database System.
The data archiving system will store the final streamflow record. The primary archive maintains data at the measurement interval; derivative archive databases contain processed forms of the primary record, such as daily values. Archival databases will be updated whenever a District produces final data. The access database components contain data in forms that are most suitable for data users for the full period of record, including both historical and provisional data.
Individual database sites will be made as fault tolerant as possible using the best available technology. The types of technology that may be used to increase reliability include Redundant Arrays of Inexpensive Disks (RAIDs), cluster server technologies, and Uninterrupted Power Supplies (UPSs). Redundant processing databases will be housed in physically separate locations with independent data feeds. Redundant routing databases will also be maintained, in order to ensure that data are being pushed out to the access databases. Similar twinning of the archival and access databases also will be implemented. In addition to providing backup for the primary site in the case of a failure in the database system, this redundancy allows the network traffic and computer processing burdens to be spread across the USGS and DOINET infrastructure.
The NSIP Database System requires personnel that are properly trained and compensated to detect and fix failures in the system 24 hours per day, in addition to supporting the regular activities of the system. These personnel will be recognized by the development of appropriate job titles, position descriptions, and provisions for compensation. Both stand-by and overtime status will be associated with an employee�s regular duties. Continuing employee education is critical in maintaining a sufficient pool of expertise to constantly maintain the Database System.
The design and implementation of the Database System should be carried out with the help of consultants or other external review. Regardless of the role of consultants, NSIP should be the major force in the design process in order to ensure that the current and future needs of NSIP are properly addressed by the final solution. The NSIP Database System should capitalize on expertise of other Federal agencies that have created an Internet-based system for disseminating real-time information. In particular, the Unified Climate Access Network (UCAN) consortium, headed by the Natural Resources Conservation Service, should be looked to as a potential model for providing national, error-free, timely data sets through the Internet. UCAN development is several years ahead of NSIP efforts. (See http://www.wcc.nrcs.usda.gov/bbook/bb20.html).
The USGS serves a variety of streamflow information products to several major Federal customers by means of multiple delivery mechanisms. Historically, time-critical information on stream stage has been transmitted by satellite telemetry or phone lines directly from streamgages to some major Federal customers (NWS, USACOE, BOR). Stage has to be converted to discharge by the customer on the basis of USGS-supplied rating curves or rating curves derived by the customer from USGS-supplied discharge measurements. This mode of information delivery remains active today.
In recent years, the Internet has become a major mechanism for delivery of streamflow information, at first by �file transfer protocol� (ftp) and increasingly by �hypertext transfer protocol� (http, i.e., by the Internet). Provisional stage and discharge measurements from streamgages with telemetry are now be posted on the Internet within 4 hours of measurement. This development has effectively reduced to zero the infrastructure that must be maintained by a customer to be able to receive and process near real-time information. Consequently, a large increase in the number of users of near real-time information products has resulted. New customers for time-sensitive data include USEPA, FEMA, State and local emergency management, transportation, and environmental agencies, and the private citizen.
For less time-critical data (historical streamflow, streamflow characteristics), information has been provided to customers through phone connections to USGS computers running software of the National Water Information System (NWIS), by published data reports sent through the mail, and by special request through the mail. Selected special-purpose data publications, such as the Hydro-Climatic Data Network dataset, have been published by the USGS and commercial companies on CD-ROM. To obtain information on streamflow characteristics at gaged sites, customers must either (1) access NWIS and generate the characteristics from historical time series using NWIS software; (2) obtain the time-series data and compute characteristics using non-USGS software; (3) make special requests for USGS staff to generate the characteristics; or (4) process data from CD-ROM using specialized software. The third option is the one most commonly chosen, as access to NWIS is limited by administrative and technical barriers. Understandably, this limits the overall access to streamflow-characteristic information by the customer.
The recent expansion of the USGS customer base as a result of electronic dissemination of near real-time streamflow information is a remarkable phenomenon. The introduction of an efficient information delivery mechanism has markedly grown and diversified the market for USGS streamflow products. Further development of the Internet-user interface(s) to near real-time and historical streamflow would undoubtedly improve service to current customers and further grow the customer base. Internet access to other information products (e.g., streamflow characteristics) could be expected to have a similar effect. Accordingly, NSIP will provide convenient, reliable access to all of its information products via the Internet. Aggressive application of evolving Internet technologies will be a hallmark of NSIP. Reliability of access will be ensured through system design, as discussed in Section 5.5.
The intricate, multi-scale, tree-like structure of the surface-water drainage network (Section 2.3) presents a challenge for information delivery and for data analysis and interpretation. Whereas geospatial information can, in principle, be referenced to a conventional latitude-longitude system, a natural coordinate system based on the structure of the drainage network is considerably more effective for many purposes. Such a system facilitates the handling of data related to stream networks, basin boundaries, drainage areas, and so forth. As explained in Section 2.3, two such systems have evolved over recent decades. The first of these is based upon successively finer partitioning of land areas on the basis of surface-water drainage divides, leading (table 1) to accounting units (�6-digit HUCs�), cataloging units (�8-digit HUCs�), and in ongoing efforts, watersheds (�11-digit HUCs�) and subwatersheds (�14-digit HUCs�). (HUC is an acronym for hydrologic unit code; the number of digits refers to the length of the number used to encode units at each level of partitioning.) The 8-digit HUCs have proven extremely successful as a framework for organization of surface-water data to date. The second system is based upon partitioning of the stream channel network. Successively more detailed efforts in this direction have led to the creation of the river reach files of the National Hydrographic Dataset (NHD), with the highest resolution provided by RF-3.
In order to achieve many of the NSIP objectives for information delivery and data interpretation, a detailed, comprehensive, and internally consistent geospatial framework for streamflow information will be created. The starting point for building this framework will be the existing systems of HUCs and NHD. A first step is to complete the definition (delineation, naming and creation of digital files of boundaries) of hydrologic units down to a level of refinement equivalent to that of RF-3; presently, the 8-digit HUCs are the finest available national watershed system. Given the magnitude of this task, the use of automated techniques may be justified or even required. One means to this end involves another basic component of the NSIP geospatial framework, namely the Hydrologic Derivatives of the National Elevation Database (NED-H). NED-H will be a hydrologically correct national elevation database. Hydrologic correctness here refers to appropriated implied surface-drainage patterns. It is anticipated that the development of high-resolution HUCs and NED-H will proceed in an interactive fashion. Known hydrography provides a basis for development and validation of NED-H, while NED-H in turn will provide a vehicle for preliminary definition of small-area hydrologic units. Defining units on the basis of NED-H will avoid inconsistencies in mapping of the drainage network that have arisen in past attempts to derive hydrologic units from maps of varying detail.
Another critical step in the construction of the geospatial framework is to connect individual RF-3 reaches to the corresponding hydrologic units. Furthermore, the connectivity among river reaches must also be defined. All of this is a monumental undertaking, involving millions of geographical units. Here again, it is anticipated that simultaneous and partially automated development alongside NED-H would be an effective way to proceed.
An integrated consistent system based on NED-H, RF-3, and NHD will provide a powerful vehicle for specifying the location of any geographic feature and for performing hydrologic analyses. This system will also need to include a set of tools for spatial and hydrologic analyses. Examples of tasks that must be readily accomplished through simple Web-based queries to a USGS information server, are the following:
Geographic locations of all hydrologically relevant entities should be determined to sufficient accuracy to permit location within the geospatial framework. Such entities include, for example, streamgages, dams, diversions for irrigation, and intakes for domestic water supply.
USGS experience in information delivery indicates that no single mechanism can be expected to provide the best solution to all information dissemination needs. It is not sufficient to put all information products on the Internet, with a �one size fits all� policy. Technologies for use of the Internet are varied and in rapid transition. At the same time, the USGS has an obligation to its long-time customers to ensure either continuation of existing delivery mechanisms or mutually planned transitions to new mechanisms. Current important modes of information delivery will not be terminated without agreement of current customers.
Perhaps more fundamentally, the nature (type, scale, complexity) of information needs of various customers differ so widely that a multiplicity of interfaces to streamflow information is a necessity. In recognition of the customer�s need for different modes of access, streamflow information will be delivered through a variety of interfaces tailored to the needs of interactive users, batch users, push customers, and USGS hydrographers. Users of a Internet-based USGS streamflow information system might fit one or more of several disparate characterizations:
In general, the growth in the number and variety of interfaces to environmental data provided by USGS and other agencies is a favorable development. The streamflow information consumer, however, is best served when datasets of similar character are accessible through similar interfaces, in similar formats. For example, USGS time series of stage or discharge are currently served as unit values (that is, at the temporal resolution of actual measurements) for the last 7 days through a real-time interface, whereas final data are readily available only as daily values. Data between 7 days and 18-24 months of age are not routinely available on the Internet. Under NSIP, all available stage and streamflow data will typically be served at the temporal resolution of actual measurement (unit value), and as user-requested time averages (daily, monthly, annual) through an interface that unifies �historical� and �real-time� databases. The current convention of providing routine access only to daily streamflow values does not meet the needs of many customers for unit values. Given the extremely low cost of data mass storage, the unit value should become the standard value for data storage.
Furthermore, USGS streamflow information products will be linked to the maximum extent possible with other USGS products and with the relevant products of other Federal agencies. Maximum advantage will be taken of existing and planned information-delivery infrastructure external to NSIP. The USGS National Atlas provides an interactive interface to numerous spatial databases of environmental and socioeconomic information and a mechanism for map-based access of geo-referenced time-series data. NSIP will become an active partner in the development of the National Atlas, to the mutual benefit of both initiatives. (Also, see Section 5.6.)
The USGS also will offer to develop partnerships for information delivery with other agencies. NWS streamflow forecasts and USGS streamflow measurements are similar types of time-series data. Where USGS streamgage sites and NWS forecast service locations coincide, the USGS should provide unified graphical presentations of NWS forecasts in the context of USGS measurements and streamflow characteristics.
Interactive users of USGS databases will have internet access to numerous user-customized maps, graphs, data tables, and miscellaneous information reports. Synoptic overviews of streamflow conditions will be presented as maps showing locations of all streamgages, with streamflow or stage status of each streamgage or gaged river reach represented using color or other devices. (If and when generally applicable techniques for streamflow estimation on ungaged reaches have been developed, such information will be similarly displayed.) User-definable map characteristics will include the spatial domain of the map and inclusion of various spatial data layers, such as topography, political boundaries, and transportation networks. Synoptic overviews of this type will be available both for current (near real-time) conditions, and for user-defined time periods in the historical record (e.g., past week, month, or year), all using a single interface. Near real-time functionality will require the ability to update rapidly the spatial data layers accessed by the interface. The interface would also provide access to near-real-time and forecast maps of flood inundation areas and maps of areas subject to inundation by floods of specified recurrence intervals; such maps would be the product of collaboration with FEMA and NWS as discussed in Section 6.6. Hydrologic base maps will be based on the geospatial framework described in Section 7.3.
Point-and-click functionality will allow the user to jump from any such synoptic streamflow map to a menu of streamgage- or reach-specific information displays; again, the National Atlas now provides such functionality. The streamgage-specific documents will include graphs of streamflow against time, including future times by means of current and planned NWS streamflow forecast information products. The user will control time ranges and layers of information on such graphs. Time-series information layers will include streamflow, estimated error bounds on streamflow (expressed, e.g., as quantiles), and normal streamflow conditions as function of date (expressed, e.g., as median flow and other flow quantiles). Extreme-flow levels of specified return periods and historical extreme events also will be available for inclusion on the time-series graphs.
Another streamgage-specific information display will provide access to information on streamflow characteristics and various station metadata. These will include the flow-duration curve, flood- and low-flows and stages of various recurrence intervals, and graphs of normal (median and various quantiles) streamflows as function of time of year. All available information on the physical setting of the streamgage and its history will be accessible. Stage-discharge relations and streamgage-site cross-sectional profiles will receive increased visibility as information products. Historical stage-discharge measurements will be accessible, as will the estimated rating curve.
For ungaged locations or reaches, the maps will provide access to information on unregulated streamflow characteristics. The methodology for their estimation will be developed within the program for assessment of streamflow characteristics. The developed methodologies will be implemented for interactive use by the customer through the internet interface. When the user selects a particular point on the drainage network, the associated basin will be determined automatically, and the relevant physical characteristics used in the regionalization relations will be computed; these functions will be accomplished using NED-H (Section 7.3). Predefined regionalization equations may be used, or relations may be developed automatically, in real time, for the site of interest , e.g., by the region-of-influence technique (Tasker and others, 1996).
One of the primary goals of NSIP is the unified presentation of temporal and spatial streamflow information on the internet. To achieve this goal, three elements are needed: (1) a temporal data system (Section 5), (2) a spatial data system, and (3) an internet interface to integrate the two types of information. NSIP efforts to provide for the fast and reliable movement of streamflow information to the Internet are most likely to succeed if the spatial data system and internet interface have also been designed to be reliable and to respond rapidly.
The National Atlas is clearly the most convenient vehicle for the cartographic display of streamflow information on the Internet. Not only is it a rich warehouse of spatial data, but it also can integrate both temporal and spatial information into a single internet presence. If the National Atlas is the primary internet presence through which NSIP streamflow information is disseminated, then it should implement fault tolerant server platforms, redundant installations on the DOINET, and sufficient human resources to ensure smooth operation at all times. The National Atlas needs to be able to withstand periods of peak demand created by interest in current storm events. NSIP Data Access Centers should be in close proximity to National Atlas servers to reduce delays caused by data being moved from one server to another.
The mechanics of the connection between the National Atlas and the Data Access Centers would be transparent to the user who would access the information via a single internet address. The web page interface and spatial data server (i.e. the National Atlas) allow the user to select streamgages (or other spatial references related to streamflow information). When the user makes a selection, the National Atlas software records the identity of the selected spatial features and other pertinent details, such as the user-requested time period. The National Atlas then would use this information to form a query that is sent to the temporal data servers (the NSIP databases). The temporal data servers would respond by sending data (and/or graphics, tables) to the National Atlas. The National Atlas then displays the results to the user. There are several choices in programming languages (e.g., C, Java, Python) that could be used to make such connections between the National Atlas and the NSIP Data Access Centers.
Information on flood characteristics has been used routinely for mapping land areas at risk for flooding; near-real-time and historical information on streamflow rates has similar potential for mapping of actual flood areas during or after an actual flood. Flood flows of given return periods can be translated, through the rating curve, to flood stages. These, together with newly available high-resolution, LIDAR-derived topographic information, can be used to delineate associated areas at risk of inundation. Existing flood-risk maps, prepared under the FEMA National Flood Insurance Program during the late 1970s and early 1980s, are in need of revision due to the availability of improved estimates of flood characteristics and improved digital elevation data. Given the availability of GIS technology, such maps should be routinely updated in the future as new information on (possibly changing) streamflow characteristics is produced by NSIP. Furthermore, the combination of high-resolution topographic information, GIS, and near real-time streamflow monitoring have created the possibility of near real-time mapping of flood inundation areas. Such information would be useful to emergency-management agencies for decision-making during flood events. An important component of both real-time and flood-risk analyses should be estimation of the uncertainties in flooded areas, as a function of uncertainties in stage measurements, topography, and modeled streamflow processes. The USGS will seek to build a partnership with FEMA, NWS, the USACOE, and other relevant agencies to design an integrated program that will modernize techniques for the generation of flood-risk maps, develop a process for routine revision of flood maps, provide near real-time maps of flood inundation areas, and provide forecast maps of flood-inundation areas. Related model development work is described in Section 8.5.
For many purposes, including numerous Federal interests, the statistical properties of streamflow, or streamflow characteristics, are just as important as actual streamflow time series. Through interpretive analyses, much valuable information on the Nation�s streamflow has been distilled from the records of thousands of USGS streamgages. For example,
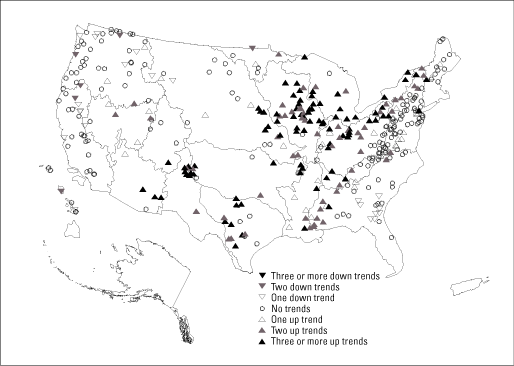
Figure 6. Trends in annual median discharge in relation to U.S. water-resources regions (Lins and Slack, 1999). Upward pointing triangles indicate increasing discharge, downward pointing indicate decreasing discharge. Open/gray/solid triangles denote stations with a trend in 1/2/3 or more time periods of analysis. Open circle denotes no trend in any time period.
Such investigations give a hint at the untapped potential within the USGS for comprehensive, national, interpretive analyses of the streamflow record. There exists, however, no general source of funding for such studies. Often the funds of interpretive analyses are available only through State and local cooperators, leading to limited, local analyses that stop at the state line. This situation fails to reap the enormous potential benefits, including both efficiency and perspective, that could be derived from national analyses. With the advent of a powerful geospatial infrastructure for surface-water information management (Section 7.3), the increased feasibility of such studies is another strong point in favor of their initiation.
A comprehensive program of data interpretation is a natural complement to a Federal streamgaging network. Such information is essential for regional hydrologic analyses, water-budget analyses, hydrologic research and trends analysis, water-quality assessments, and ecological analyses. This sections outlines the rationale and design for a national program of assessments of streamflow characteristics.
The value of streamflow time series from streamgages is multiplied when the records are subjected to systematic analysis and interpretation. Streamflow records from any gaged site contain information on both the actual streamflow during the period of record, as well as the statistical properties (means, flood recurrence intervals, low-flow characteristics, and so forth) of the streamflow. To the extent that the streamflow process is stationary (statistical properties do not change with time), this information also is indicative of future streamflow conditions at the site and is, therefore, relevant for a variety of practical applications. The stationarity of the process must be established by trend analysis. In addition to providing information on future streamflow conditions at the gaged site, the streamflow characteristics, properly interpreted, provide information on streamflow conditions at other hydrologically similar sites. The similarity of hydrologic response across basins allows information from gaged basins to be used in estimation of the streamflow characteristics of ungaged basins by means of regionalization (Wahl and others, 1995). Because the number of ungaged stream basins in the smaller sizes will always far exceed the number of gaged basins (Section 2.3), regionalization is a crucial component of the overall USGS program of streamflow information processing.
With a few exceptions (for example Benson and Carter, 1973), analyses of streamflow characteristics have been conducted at infrequent and irregular intervals, and typically are limited to statewide analyses (Jennings and others, 1994). Whereas such studies generally meet the immediate needs for which they are designed, they fail to provide a national, or even regional, perspective on streamflow conditions. The institution of a Federal program of data interpretation would reveal for the first time regional and national patterns of streamflow characteristics and their temporal trends. At the same time, it is expected that a regional to national focus would even improve estimates of local characteristics, by expanding the data upon which any local estimate is based.
The USGS will establish a permanent, national program of regional streamflow assessments to address at-site streamflow characterization, trend analysis, and regionalization. Each assessment will yield the following products:
Physiography exerts a major control on hydrologic characteristics. Accordingly, even if the assessments are conducted mainly from a national perspective, it may be useful to stratify analyses according to physiographic provinces. Ultimately, it would be an objective of research to develop sufficient understanding of physiographic controls on streamflow to remove any necessity for such stratification. Any geographic partitioning of the Nation for the streamflow assessments would be based upon major physiographic provinces of the Nation. It is expected that new analytic tools, such as region-of-influence regression (Burn, 1990; Tasker and others, 1996), will be employed to provide seamless assessments within, and ultimately across, regions. Study regions would be defined in such a way as to cover all land areas of the Nation with about 15-30 regions. An example of the application of such physiographic provinces to the characterization of interactions between surface and ground water is given by Winter and others (1998) and Winter (1995).
The assessment program will be run on a 10-year cycle. Assessments must be repeated periodically to incorporate new measurements, to track nonstationarity and low-frequency variability of streamflow, and to incorporate continuing advances in assessment techniques. Each assessment will build upon previous work, entrain and apply new methods of analysis, consider emerging water-resource issues and related streamflow characteristics, assess physical changes in the study region, and re-evaluate previous conclusions in light of new data.
The 10-year cycle would facilitate the flow of information from the program to other related initiatives that might be conducted on a similar schedule. One important opportunity for the USGS would be to integrate outputs from these streamflow assessments and from the 5-year water-use assessments, along with information on ground water and ecological conditions and resources, to produce a comprehensive assessment of the water resources of the Nation. Such an effort is probably beyond the scope of NSIP, but NSIP assessments would contribute immensely to it.
Assessments will include analyses of numerous streamflow characteristics, including mean and median flows, flood and low-flow characteristics, normal seasonal cycles, and measures of streamflow variability, such as baseflow/runoff ratios. Assessments also will include identification of the effects of major reservoirs on streamflow and streamflow characteristics, including comparison of estimated natural streamflow with reservoir-impacted flows. Data other than stage and discharge are collected routinely at streamgages. Channel geometry, velocity distributions, and rating curves all contain information on temporal variations in the riverine environment. Their careful interpretation could yield valuable information on channel stability and habitat, or lead to improvements in the estimation of streamflow. Regional assessments will investigate the potential to derive useful information on the stream environment from ancillary records used in the estimation of streamflow.
The assessment program will have a strong national interpretive focus, evaluating geographical patterns and temporal trends in streamflow characteristics from a national perspective. Significant temporal variations in streamflow characteristics will be identified and related to changes in the physical environment. The program will address such questions as �Has flooding increased in the Nation in recent years? What are the impacts of ENSO (El Nino Southern Oscillation) on the national water supply? Can we see greenhouse warming in the national streamflow record?�
Several limitations of historical approaches to estimation of streamflow characteristics, trend analyses, and regionalization are worth noting, particularly in light of recent scientific and technological developments:
In view of these developments, NSIP streamflow assessments will increasingly include the effects of nonstationarity and deterministic controls on temporal variations of streamflow. The need for such a viewpoint has been voiced in the scientific literature from time to time, most recently by Shuttleworth (1999). Additionally, NSIP streamflow assessments will employ techniques that utilize fully the available environmental information and computing power.
One of the highest priorities of the Federal network is to support the production of information on streamflow characteristics. In the proposed initial approach to evaluating contributions of streamgages to Federal information needs, the streamflow characterization objective is represented in a very simple way. A more rational method would be based upon the potential for decrease in variance of estimated streamflow characteristics associated with introduction of a given streamgage (Moss and Karlinger, 1974; Medina, 1987). The essential backdrop for such an evaluation is the present level of uncertainty in streamflow characteristics at ungaged sites. Regionalization errors determined in the course of NSIP streamflow assessments will be fed back into the network design process. In those areas or environmental settings where estimation variance is largest, it can be expected that additional measurements may have the greatest value. The general approach should recognize the potential for nonstationarity, which is expected to favor, to some unknown degree, the continuation of long-term streamgages over frequent shifting of streamgage locations.
Statistical characteristics of the streamflow process, including mean and extreme flows, are strong determinants of water chemistry. Streamgaging alone cannot address the streamflow information needs of programs for the characterization and mitigation of water-quality degradation. As of 1998, the USEPA faced lawsuits in 43 States for failure to define TMDL allocations as required by the Clean Water Act. TMDL allocations need to be prescribed at the level of low-order stream reaches defined in RF3 (Section 2.3). Streamflow information is required for the definition of the TMDL allocations, and such spatially detailed information can only be obtained by modeling (Section 8.4) or by regionalization. Therefore, the program for assessment of streamflow characteristics will address the streamflow-information needs created by Federal water-quality legislation.
The timing and variability of streamflow, which can be quantified by appropriately defined streamflow characteristics, can be major factors affecting aquatic ecology (Poff and others, 1997), through their influence on water chemistry and physical habitat. Current, accurate, regional information on streamflow characteristics, including trends, has potential to help explain spatial and temporal variations in aquatic ecosystems in the context of the NAWQA Program. The NSIP program for assessment of streamflow characteristics will collaborate with the NAWQA Program to ensure maximum relevance of NSIP streamflow-characteristic products to investigations of water chemistry and aquatic ecology. Such collaboration is important because traditional measures of the streamflow process focus on characteristics that are not necessarily the most appropriate for NAWQA studies.
The most commonly used technique for streamflow estimation (continuous stage measurement, correlated to periodic cross-sectional surveys of velocity using velocity meters) has remained essentially unchanged for a century. For the most part, this is a tribute to the robustness, accuracy, and cost-effectiveness of the technique. Concerns for personal safety, accuracy, reliability, cost, and efficiency, however, provide justification for ongoing efforts to identify and develop new and emerging technologies for streamflow measurement. NSIP will pursue research and development on new and emerging technologies for non-contact estimation of stream velocities, stage, and total discharge. Ideally the streamgaging station of the future would operate as shown in figure 7, where stage, cross section, and velocity are all determined by remote sensing from the side of the river, without contact with the stream. Such a system would have special value in unstable channels, especially during flood events, when changes in the channel configuration are most likely to occur.
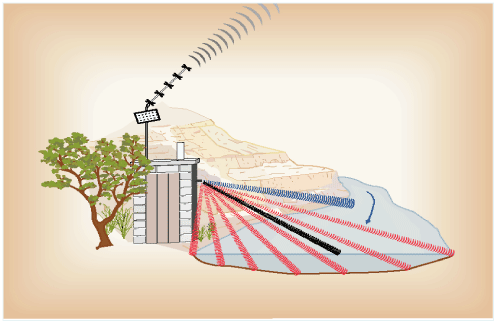
Figure 7. Conceptual diagram of a total non-contact streamgaging station with satellite telemetry for real-time data delivery. colored beams indicate simultaneous sensing of stage (black), velocity (blue), and channel depth (red).
Radar technology has been identified by the Water Resources Discipline Hydro 21 committee as a promising approach for measurement of surface velocity and channel cross section from a single platform. Radar has been applied successfully to the measurement of ocean surface velocities and (using ground-penetrating radar) channel cross-sectional geometry (Spicer and others, 1997). In April 1999, the USGS completed a proof-of-concept streamgaging experiment on the Skagit River, Washington, using such technologies (Costa and others, 2000). As appropriate, feasibility studies will be followed by timely development activities.
Surface velocity measurements, such as those potentially provided by a radar system, can be used to estimate discharge only when they are extrapolated downward through the stream depth. Standard velocity profiles are known from past measurements, but the use of only a surface measurement to scale such profiles would ordinarily result in considerable error in discharge estimates. Research and development efforts are needed in order to quantify and reduce such errors, with attention to such controlling factors as stream environment and ambient wind conditions. Local hydrodynamic modeling might play a role in such analyses.
Acoustic Doppler technology also holds promise for improvements in the streamgaging program. The Acoustic Doppler Current Profiler (ADCP) was originally developed for use by oceanographers for the measurement of deep ocean currents. Recently, the technology has been adapted to the riverine and estuarine environment and is finding widespread application in the measurement of large river streamflows and the collection of three-dimensional velocity data commonly needed for hydraulic models. The ADCP is faster, safer, and more versatile than traditional streamflow measurement methods while maintaining the same accuracy. ADCPs often eliminate the need for measurements from cableways and bridges, resulting in greater safety to field personnel and added flexibility in choosing good measurement sections. The current generation of ADCPs is limited in application to large rivers with depths greater than about 0.67 m. Further development of this technology is needed to facilitate the use of ADCPs in shallower streams. NSIP will promote development and application of ADCP�s in the streamgaging program.
Flood flows are determined directly through either discharge measurement or an established rating curve. Direct determination of flood flows, however, is difficult because floods often destroy streamgaging stations resulting in a loss of record are of such a magnitude that extrapolation of the stage-discharge rating is not possible, are too extreme to allow direct measurement of discharge, or occur at locations without streamgages. Peak flow information however, is critical for the extension of stage-discharge relations at streamgages and for flood-frequency analysis, as well as other applications. Techniques for indirect estimation of high flows are therefore a critical component of a streamflow information program. Existing indirect flow measurement techniques are expensive, and they rely on the simplifying hydraulic assumption that the flow is steady, and one-dimensional. All natural flows, however, depart to some degree from these assumptions.
NSIP will include experimental and theoretical research to identify the important controlling hydraulic processes of flood flows, develop new, more cost-effective indirect methods of estimating flood flows, (Section 8.9), and develop cost-effective means to reconstruct peak flows. Included in the research will be the following:
dentification of flood characteristics usually rely entirely on the streamgage record and direct measurements made during floods. Paleoflood investigations have the potential to add information to the flood record on the rarest, most extreme events. Advanced statistical methods have been developed to incorporate paleoflood data into conventional flood-frequency analyses. Paleoflood data, however, may also introduce bias into the flood record because paleofloods may have occurred under climatic conditions different from conditions experienced during the gaged period. In conjunction with the development of indirect methods, NSIP will develop guidelines for identification and interpretation of ancient flood deposits to enhance estimates of extreme flood characteristics.
Quality-assurance techniques will be developed to ensure the accuracy and to quantify the uncertainty of streamflow data. Although the effectiveness of the techniques proposed in this document (Appendix B in Section 12) have been demonstrated in other disciplines, little direct evidence is available to support their immediate application for the streamgaging program. Therefore, work is needed to ensure that the proposed (or alternate) techniques are thoroughly evaluated both for their technical adequacy and for their practical utility. Such an evaluation also needs to consider the wide range of hydrologic conditions in which the techniques will be applied and the diverse group of hydrographers responsible for their implementation.
Priorities for demonstration, development, and research include:
The process of refining quality-assurance techniques will need to be an on-going process.
A comprehensive vision for the future of streamflow information must define the role, if any, that modeling will play in the production of information. The historical strategy of the USGS for obtaining streamflow information is to make high-quality, continuous measurements of discharge at sites where such information is critical for planning, designing, and assessment. The overall success of this strategy is evident in the high value attached to USGS streamflow products by water-resource professionals. Summarizing an analysis of the cost effectiveness of the USGS streamgaging program for the period 1983-88, Thomas and Wahl (1993) concluded that flow routing and statistical techniques for estimating streamflow are generally not accurate enough to replace existing streamgages for most purposes. A more detailed report of a pilot study for the analysis was provided by Fontaine and others (1984).
The proposal here for new efforts to produce streamflow information from modeling is based on the concept that modeling can supplement the streamflow information obtained by streamgaging, but modeling cannot replace it. Consistent with its objectives, the analysis summarized by Thomas and Wahl (1993) held modeling to the same standards of accuracy as streamgaging. For purposes needing the accuracy provided by streamgages, modeling will not suffice. Modeling may provide cost-effective streamflow information for other purposes, including those for which spatially detailed information of low to moderate accuracy (by streamgaging standards) is more valuable than high accuracy at a single point. For example, water-quality investigations increasingly focus on non-point-source problems, which are not readily addressed by one or two strategically placed streamgages. Widespread and relatively recent (in the history of USGS streamgaging) concerns for restoration and preservation of water quality and aquatic and riparian habitat generate new needs for streamflow information. Models also have potential, as a qualitatively distinct alternative to regionalization, for the estimation of streamflow characteristics (National Research Council, 1992).
Recent advances in modeling techniques, precipitation-observing systems, and computing technology are also factors contributing to the possibility of a new role for modeling in a streamflow information program (fig. 8). In recent decades, the scientific community, including the USGS, has developed an array of powerful computational tools for modeling watersheds and flow in stream channels. Models are used routinely by other Federal entities (e.g., USACOE, NWS, Tennessee Valley Authority), in conjunction with measurements, to carry out their missions. At the same time, a national network of Doppler radar is providing unprecedented measurements of precipitation, the dominant driver of streamflow variations. By initiating a program of routine modeling for streamflow on selected basins, the USGS would be able to provide a new information product that builds upon historical strengths in measurement and modeling. The potential ultimate scope of a streamflow modeling program is great, but the optimal scope is unknown. In order to support prudent, strategic decision-making on the future role of the USGS in streamflow modeling, the USGS will initiate a set of pilot studies to determine the cost effectiveness of and demand for a national program of model-derived streamflow information products.
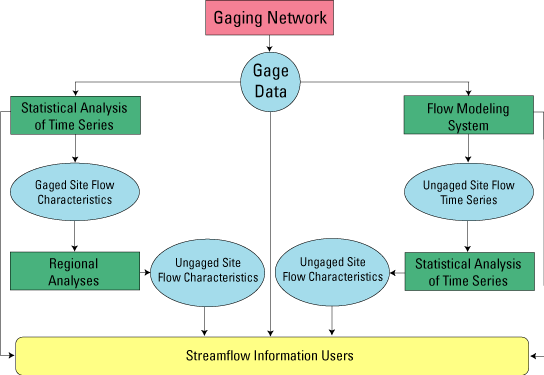
Consistent with the two-scale nature of the streamgaging problem described in Section 2.3, a two-scale approach will be adopted for the modeling pilot studies:
This two-scale approach is chosen to reflect the potential scale range of a possible national streamflow-modeling system.
The selection of study units will consider potential compatibility of the information product with local information needs. One possibility for consideration would be the collocation of one or more of the modeling studies with study units of the NAWQA Program.
Consistent with the exploratory nature of this initiative, a variety of modeling techniques will be employed. One approach might use observed records of precipitation, gaged streamflow, and basin characteristics to develop statistical models for streamflow. Another might employ fully deterministic, coupled models of soil-water dynamics, ground water dynamics, and open-channel flow. Expected common features of all approaches at both scales will include the use of precipitation data as input and the use of streamgage streamflow measurements for model calibration and evaluation. Furthermore, all systems will require the use of geographic information to extrapolate gaged-basin response to ungaged-basin response. In this respect, the models are required to be more general than a model used only for quality-control of streamgage measurements, because the latter model can be �trained� by use of historical streamflow measurements.
Section 6.6 proposed a partnership to develop improved products both for flood-risk assessment and for real-time flood warnings. Both objectives would benefit from (and, in some cases, require) the development and application of versatile flow models for the river and floodplain environment. Such models must be capable of handling such phenomena as two-dimensional overbank flooding, mixed sub-/super-critical flow situations, and moving boundaries. Accordingly, versatile, two-dimensional, non-steady channel flow models will be developed for use in flood inundation analyses. Attention should also be given to the construction of graphical user interfaces and training for such models.
The need for assessments of streamflow characteristics to address issues of deterministic control and nonstationarity was explained in Section 7.3. These can be addressed in a preliminary way using extensions of existing analytic tools, but rigorous treatment will require development of new techniques. Accordingly, NSIP streamflow assessments will be tied closely to a program of techniques development. Investigators responsible for the assessments will work in collaboration with researchers on the development of these new analytical tools.
An issue not raised in Section 6 is that of estimating spatial correlation of extreme events. In current approaches to regionalization, it is usually assumed that spatial correlation, for example, of annual peak streamflows is a function only of distance between sites. In reality, the correlation depends in a complex way on the relative positions of the basins being gaged, the geometry of their drainage networks, and the spatio-temporal structure of the associated precipitation event. Stream network-based research on regional correlation of extreme events has potential to improve the accuracy of existing regionalization techniques.
In general, a more radical departure from historical approaches to trend analysis and regionalization may prove productive. As mentioned in the discussion of streamflow modeling (Section 8.4), dynamic river basin models may have a future role in the assessment of streamflow characteristics. The advantage of such an approach would be the natural ability to incorporate physical changes in the land environment and influences of atmospheric processes. Therefore, developments in streamflow modeling capabilities proposed elsewhere would have potential long-term rewards for the streamflow-characteristic assessment program.
The analysis of Federal interests described in Section 2.4 recognized the need for streamgaging stations for regionalization and trend analysis. Because of constraints on time and methodology, the regionalization and trend objectives were approached simplistically. It was assumed that the set of areas created by intersection of accounting units with ecoregions would adequately capture the spatial variability of basin hydrologic characteristics. For trends, it was assumed that the existing HCDN is an adequate network, even though the HCDN is simply a �network of opportunity� composed of pre-existing streamgages that happen to meet criteria defined for certain trend applications. While the overall numbers of streamgages specified in Section 2 for these purposes is considered a best current estimate, it is likely that the information provided by any new streamgages could be significantly increased by careful consideration of optimal network design. Therefore, existing methods will be further developed and applied for optimal design of a dynamic streamgaging network for regionalization and trend analyses. Examples of such an approach have been presented by Medina (1987) and by Moss and Tasker (1991).
The long-term and multi-purpose nature of the USGS streamgaging program gives a special character to the problem of network design for regionalization and trend analysis. A fundamental input to any regionalization or trend analysis is the existing database of streamflow data from thousands of existing and discontinued sites that have been operated by the USGS over the past 120 years. Additionally, certain currently operated sites can reasonably be assumed to operate into the future, because they are needed for other, usually site-specific, purposes beyond regionalization or trend analysis. The past and expected future data can be expected to provide a partial picture of the spatial and temporal variations in streamflow characteristics now and into the future. The goal of a streamgaging program for regionalization and trend analysis, therefore, should be to identify how best to fill in the missing pieces of the picture. What is generally needed in practice is a set of tools with which to determine where, when, and how to enhance the existing streamgaging network in the most cost-effective manner. Generally, effectiveness can be quantified by reduction in some measure of error.
Partial-record streamgaging (peak flow, low flow) stations can provide some of the information needed for analysis of flow characteristics at a fraction of the cost of continuous-record streamgaging. Somewhat analogously, field surveys after major flood events and during severe droughts (Section 4) also can provide valuable information at relatively low cost. What is an optimal mix among continuous-record stations, partial-record stations, and synoptic surveys associated with critical events? New network-design techniques are needed to help answer this question.
Existing network-design strategies are based on the assumption of stationarity (Section 7.3). Under stationary conditions, errors in regionalizations are associated with at-site estimation errors, due to finite length of record, and with regression errors, due to imperfect relations between the identified predictor variables and the estimated streamflow characteristics. As the length of record at a site grows, the incremental value of new data decrease over time. At some point, the streamgage should be moved to a previously ungaged site, in order to reduce the error associated with the regression itself. Under non-stationary conditions, however, some mix of permanent �index� sites and mobile (albeit on a decadal or longer time scale) sites can be expected to provide regional streamflow information efficiently. Even under stationarity, the permanent sites are needed in order to confirm the absence of trends and to identify the low-frequency temporal fluctuations in climate that affect the short-term streamgage records. Research is needed to help define the optimal tradeoff among permanent and rotating streamgages, with consideration of the presence of long-term trends.
The major goal of the streamflow assessments is to quantify patterns and trends in streamflow characteristics. Research will be required if an understanding of the physical controls on these patterns and trends is to be obtained. The USGS will undertake a program of research into the physical causes of spatial and temporal variations in streamflow characteristics. This research should be undertaken as an integral part of the assessment program and in coordination with techniques development. Products of the assessment will feed into research activities. In turn, research will help to develop understanding of streamflow variations. Improved understanding will contribute toward the further development of improved techniques for regionalization.
The controls on spatial variations in streamflow characteristics are fairly well understood, at least at a qualitative level. For example, basin area, main channel slope, elevation, and mean annual precipitation are recognized as quantities whose variations are associated with those of streamflow characteristics. Historically, such independent variables have proven useful in regionalization studies. It is hypothesized that these variables are simply surrogates for more direct physiographic and climatological controls of streamflow characteristics. This hypothesis can be tested through research. For example, relatively new information on topographic structure of the land surface, such as that contained in 30-m digital elevation models, might be employed to develop indices that are predictive of streamflow characteristics. This is a reasonable expectation, as such indices have proven useful in understanding runoff-generation mechanisms. Likewise, it is reasonable to expect that seasonal and storm-oriented measures of precipitation would serve better than annual precipitation as predictors of streamflow characteristics. Soils information, now available on a national basis, adds information of a sort that heretofore has not generally entered regional flow studies. Clearly, research on these problems could lead to new understanding of controls of streamflow processes and, consequently, to improved tools for predicting streamflow characteristics.
Controls on temporal variations in streamflow characteristics have received less attention than controls on spatial variations. Temporal variations result from long-term changes of the land surface and the stream network, usually associated with land and water development, and from low-frequency fluctuations and long-term changes in the climate system. Some factors associated with land and water development have been addressed in the analogous problem of spatial regionalization in urban basins. An initial problem for research is to determine whether the same relations that have been developed for spatial regression in urbanized areas can be applied to predict temporal changes. As mentioned in Section 7.3, multiple types of climatic fluctuations and transients have potential to explain temporal variations in streamflow characteristics. It is important to begin to sort out the separate effects of land and water development, natural climatic variability, and long-term climatic change (local, regional, and global) on variations in streamflow characteristics.
The current streamgaging network of the USGS is facing an important crossroads. The existing streamgaging program has significant merits, and has produced important data. Incremental new resources should be applied to changes in the information system organization, data delivery, and regional and national assessments first. Expansion of streamgaging stations should be a second-order priority after information delivery and software system upgrades are implemented.
As new funding for NSIP becomes available, it should be applied to three major program components in the following order:
The following sections describe actions required regardless of the outcome of NSIP.
Benson, M.A., and Carter, R.W., 1973, A national study of the streamflow data-collection program: U.S. Geological Survey Water-Supply Paper 2028, 44 p.
Box, G., and Luceno, A., 1997, Statistical control by monitoring and feedback adjustment: New York, John Wiley, 327 p.
Burn, D. H., 1990, An appraisal of the "region of influence" approach to flood frequency analysis: Hydrological Sciences Journal, vol. 35, p. 149-165.
Constantz, J., 1998, Interaction between stream temperature, streamflow, and groundwater exchanges in alpine streams: Water Resources Research, 34, 1609-1615.
Costa, J.E., Spicer, K.R., Cheng, R.T., Haeni, F.P., Melcher, N.B., and Thurman, E.M., 2000, Measuring stream discharge by non-contact methods: a proof-of-concept experiment: Geophysical Research Letters, v. 27, p. 553-556.
Fontaine, R. A., Moss, M. E., Smith, J. A., and Thomas, W. O., Jr., 1984, Cost effectiveness of the streamgaging program in Maine - A prototype for nationwide implementation: U.S. Geological Survey Water-Supply Paper 2244, 39 p.
Gebert, W. A., Graczyk, D. J., and Krug, W. R., 1987, Average annual runoff in the United States, 1951-1980: U. S. Geological Survey Hydrological Atlas 710, 3 maps on 1 sheet.
Hirsch, R. M., Alley, W. M., and Wilber, W. G., 1988, Concepts for a national water-quality assessment program: U. S. Geological Survey Circular 1021, 42 p.
Holtschlag, D.J., and Grewal, M.S., 1998, Estimating ice-affected streamflow by extended Kalman filtering: Journal of Hydrologic Engineering, July, p. 174-181.
Jennings, M. E., Thomas, W. O., Jr., and Riggs, H. C., 1994, Nationwide summary of U.S. Geological Survey regional regression equations for estimating magnitude and frequency of floods for ungaged sites, 1993: U.S. Geological Survey Water-Resources Investigations Report 94-4002, 196 p.
Jones, J. L., Haluska, T. L., Williamson, A. K., and M. L. Erwin, 1998, Updating flood inundation maps efficiently: building on existing hydraulic information and modern elevation data with a GIS: U.S. Geological Survey Open-File Report 98-200, 12 p.
Lanfear, K. J., 2005, A near-optimum procedure for selecting stations in a streamgaging network: U.S. Geological Survey Scientific Investigations Report 2005-5001.
Leopold, L., 1962, Rivers: American Scientist, v. 50, p. 511.
Lins, H. F., and Slack, J. R., 1999, Streamflow trends in the United States: Geophysical Research Letters, v. 26, p. 227-230.
Medina, K. D., 1987, Analysis of surface-water data network in Kansas for effectiveness in providing regional streamflow information, with a section on theory and application of generalized least squares by Gary D. Tasker: U.S. Geological Survey Water-Supply Paper 2303, 28 p.
Moss, M. E., and Karlinger, M. R., 1974, Surface water network design by regression analysis simulation: Water Resources Research, v. 10, p. 427-433.
Moss, M. E., and Tasker, G. D., 1991, An intercomparison of hydrological network-design technologies, Hydrological Sciences Journal, v.. 36, p. 209-221.
National Research Council, 1991, Opportunities in the Hydrological Sciences: National Academies Press, Washington, D.C., 348 p.
National Research Council, 1992, Regional hydrology and USGS streamgaging network: National Academy Press, 24 p.
National Research Council, 1999, Hydrologic Hazards Science at the U.S. Geological Survey: National Academies Press, Washington, D.C., 92 p.
Osterkamp, W. R., and Emmett, W. W., 1992, The Vigil Network -- long-term monitoring to assess landscape changes, in Bogen, Jim, Walling, D. E., and Day, T. J. (eds.), Erosion and sediment transport monitoring programmes in river basins: International Association of Hydrological Sciences Publication No. 210, p. 397-404.
Poff, N. L., Allan, J. D., Bain, M. B., Karr, J. R., Prestagaard. K. L., Richter, B. D., Sparks, R. E., and Stromberg, J. C., 1997, The natural flow regime: a paradigm for river conservation and restoration: BioScience, v.. 47, p. 769-784.
Seaber, P. R., Kapinos, F. P., and Knapp, G. L., 1987, Hydrologic unit maps: U.S. Geological Survey Water-Supply Paper 2294, 63 p.
Shuttleworth, W. J., 1999, New worldwide hydrological initiative needed: EOS Transactions American Geophysical Union , v.. 80, no. 3, p. 103.
Slack, J. R. and Landwehr, J. M., 1992, Hydro-climatic data network (HCDN): a U.S. Geological Survey streamflow data set for the United States for the study of climate variations, 1874-1988: U.S. Geological Survey Open-File Report 92-129, 193 P.
Slack, J. M., Lumb, A. M., and Landwehr, J. M., 1993, Hydro-climatic data network (HCDN): streamflow data set 1874-1988: U.S. Geological Survey Water Resources Investigations Report 93-4076, 1 computer laser optical disk.
Spicer, K.R., Costa, J.E., and Placzek, G., 1997, Measuring flood discharge in unstable stream channels using ground-penetrating radar: Geology, v.. 25, p. 423-426.
Spinello, A. G., and D. L. Simmons, 1992, Base flow of 10 south-shore streams, Long Island, New York, 1976-85, and the effects of urbanization on base flow and flow duration: U.S. Geological Survey Water-Resources Investigations Report 90-4205, 34 p.
Strahler, A. N., 1952, Hypsometric (area-altitude) analysis of erosional topography: Bulletin Geological Society of America., v.. 63, p. 1117.
Tasker, G. D., Hodge, S. A., and Barks, C. S., 1996, Region of influence regression for estimating the 50-year flood at ungaged sites: Journal American Water Resources Association , v.. 32, p. 163-170.
Thomas, W. O., Jr., and K. L. Wahl, 1993, Summary of the nationwide analysis of the cost effectiveness of the U.S. Geological Survey streamgaging program (1983-88): U.S. Geological Survey Water-Resources Investigations Report 93-4168, 27 p. U.S. Geological Survey, 1998, A New Evaluation of the USGS Streamgaging Network--A Report to Congress, 20 p.
U.S. Geological Survey, 1999, Streamflow Information for the Next Century: U.S. Geological Survey Open-File Report 99-456, 13 p.
U.S. Water Resources Council, 1968, The Nation's water resources, Parts 1-7, The first national assessment of the Water Resources Council: Washington, D.C., 414 p.
Wahl, K. L., Thomas, W. O., Jr., and Hirsch, R. M., 1995, The streamgaging program of the U.S. Geological Survey: U.S. Geological Survey Circular 1123, 22 p.
Webb, R. H., and Betancourt, J. L., 1992, Climatic variability and flood frequency of the Santa Cruz River, Pima County, Arizona: U.S. Geological Survey Water-Supply Paper 2379.
Winter, T. C., 1995, A landscape approach to identifying environments where ground water and surface water are closely interrelated: Groundwater Management, Proc. Intl. Symp. Water Resources. Engineering Div., Amer. Soc Civil Engineers, San Antonio, Texas August 14-16, 1995, p. 139-144.
Winter, T. C., Harvey, J. W., Franke, O. L., and Alley, W. M., 1998, Ground water and surface water, a single resource: U.S. Geological Survey Circular 1139, 79 p.
The streamgaging network analysis tool applies the expert knowledge of hydrographers to a GIS database of rivers, streamgaging stations, and related information to determine how well the network meets specified goals (Section 2.4). The tool can extend this knowledge to find a near-optimal set of stations meeting a specified set of quantifiable goals (Lanfear, in press).
Streamgage network analysis starts by identifying locations where streamflow information is needed to meet each of the Federal goals. For each goal location, (e.g. a single NWS service location, or one watershed) the analysis tool looks at the network of stations and stream reaches to find all combinations of active, inactive, and new stations that could meet that goal. Any combination of stations that provides the requisite streamflow information is a potential solution. The analysis excludes those solutions that have redundant stations or that are obviously inferior to other available solutions. For example, feasible solutions for an NWS forecast service location might include a new station co-located at the service location, an active station on a reach just downstream, or two reactivated stations on nearby upstream tributaries. As another example, if there were two stations on the same reach as the service location, each would be a separate solution; both together is not a feasible solution because only one station is needed.
Once the tool determines all feasible solutions for all the goals, it compares these solutions to the active stations to determine which goals are satisfied. The tool then tries each remaining solution to find the one with the best benefit-to-cost ratio for the remaining (i.e. unmet) goals; it repeats this step until all the goals are satisfied. In selecting a solution, the analysis tool considers the cost assigned to each type of solution. Continuing an active station is preferred to reactivating an inactive station, and using an existing (active or inactive) station is preferable to building a new one. Solutions that satisfy multiple goals tend to be preferred over single-goal solutions. The procedure can either assume the active stations as a "given" or can "start from scratch" and include active stations only as appropriate.
At present, the evaluation has only been implemented for the 48 conterminous U.S. The geospatial infrastructure does not currently exist for Alaska, Hawaii, and Puerto Rico; however, work is currently underway to resolve this deficiency.
| Goal | Principal Criteria (These criteria are not necessarily the same as used in the Report to Congress. Some have been added and others modified to reflect better insights or advances in modeling.) |
|---|---|
| Compacts and Decrees | Each compact or decree is associated with a specific USGS station. |
| Cross-Border Flows | Applies to reaches with >1300 km2 (500 mi2) drainage that cross interstate or international boundaries. Must include 90-110 percent of the drainage basin and be within 50 km of point of interest as measured along the stream. A solution may have no more than 3 streamgaging stations and each must have a drainage area at least 20 percent the size of the target reach. |
| Current NWS Flood Forecast Sites | Must include 90 - 110 percent of the service location's drainage area and be within 20 km of point of interest. A solution may have no more than two streamgaging stations, and each must have a drainage area at least 20 percent the size of the service location. |
| High-Population Floodplains | Applies to USEPA RF1 reaches having more than 1,000 people in the 100-year floodplain. Must include 75 - 125 percent of the floodplain reach's drainage area and be within 50 km of point of interest. A solution may have no more than two streamgaging stations, and each must have a drainage area at least 20 percent the size of the floodplain reach. |
| Accounting-Unit Water Budgets | Must include 75-125 percent of the accounting unit drainage, with no more than 25 percent of the drainage outside the accounting unit. Large mainstream rivers flowing through the basin are not included in the totals. Where possible, only uses reaches with existing (active or inactive) streamgaging stations, but will accept new stations if necessary. If possible, the number of streamgaging stations in a solution will be limited to three. If no solution is found with three or fewer stations, then as many as four stations will be accepted. |
| Hydro-Climatic Data Network (HCDN) | Must be an exact match to a USGS streamgaging station. |
| Regionalization (1,2) | One (base) or two (full) streamgaging station(s) for each intersection of ecoregions with accounting units. Each streamgaging station must have a drainage area of less than 100 mi2 (500 mi2 if it is a HCDN station) and the drainage must be entirely within the ecoregion-accounting unit intersection. |
| Federal Reservoirs | Applies to federally owned or operated reservoirs having at least 6.2 M m3 (5,000 acre-feet) normal capacity. Must include 100-110 percent of the drainage basin and be within 20 km. A solution may have no more than two streamgaging stations, and each must have a drainage area at least 20 percent the size of the reach with the reservoir. |
| Quality-Impared Cataloging Units | Applies to cataloging units listed by USEPA Index of Watershed Indicators to have more than half of its reaches with water quality impaired. Must include 75-125 percent of the accounting unit, and no more than 25 percent outside the unit. Mainstream rivers flowing through the basin are not included in the totals. Where possible, only reaches with existing (active or inactive) streamgaging stations are used, but will accept new streamgaging stations if a basic feasible incremental solutions (BFIS) cannot be found with existing stations. If possible, the number of streamgaging stations in a solution will be limited to three. If no solution is found with three or fewer streamgaging stations, then as many as four stations will be accepted. |
| National Stream Quality Accounting Network | Must be an exact match to a USGS streamgaging station. |
| Wild and Scenic Rivers | Must either be on one of the reaches, or must include 75-125 percent of the drainage basin of the most downstream reach and be within 50 km as measured along the stream. A solution may have no more than two streamgaging stations and each must have a drainage area at least 20 percent the size of the target reach. |
Under NSIP, the database and software systems for receiving and processing streamflow data will move from District-based computers to a centralized multi-server system that takes advantage of the Internet to provide high reliability and economy of scale. Collection and review of the data can occur at locations remote from the locations used for storage and access. The Database System will contain separate components, one each for data collection, review, routing, archiving, and access. The functions of both data collection and review will be performed at Data Processing Centers, whereas archiving and access functions will be centralized at Data Access Centers, which deliver streamflow information to the public through associated Internet interfaces.
The separate system components (data collection, review, routing, archiving, and data) are required to provide most effective design for each component of the database and software system component as a function of the intended use of the system. Components of the Database System will be centralized as much as possible to reduce costs of maintenance. Fewer computers, databases and related software installations obviously require fewer human and financial resources to administer. The creation of Data Processing Centers to replace the NWIS real-time systems currently present in almost all Districts will remove the need to have database management and NWIS/NSIP software administration expertise in every District. The system design, however, will not be centralized to the point that the Database System is susceptible to failure of one or even several components. Nor will the design be centralized to the point that the Database System components are unable to respond rapidly to USGS hydrographers or public customers.
Hydrographers in District offices will be the primary users of the Data Processing Center database and software, which they will access through Internet pages. The processing databases generally will be unavailable to other users. The actual database being accessed will be chosen at the time that the hydrographer loads the web page into his/her web browser. The processing database with the fastest network connection to the hydrographer's location and the fastest hardware/software response time will be chosen. The duplicate processing centers will spread the network and processing burden of real-time data collection, processing and distribution activities as efficiently as possible across the Department of Interior's Internet (DOINET) and WRD computers. No processing center should be idle while another is running at full capacity. This minimizes delays created by many hydrographers competing for limited computing resources and Internet bandwidth associated an individual data processing. These types of delays have been a major problem with previous efforts to centralize data processing and are a limiting factor on how feasible is a centralized system. Although high-power processing centers resolve many types of bottlenecks, the importance of Internet bandwidth should not be underestimated. The large number of duplicate processing centers also guards against the negative impact of failure of one or more processing centers or links in the DOINET.
The tasks accomplished at the Data Processing Centers are interrelated. Streamflow is computed from stage using a rating curve, which is represented by a line drawn on a plot of measured stage and direct measurements of discharge. Periodically, there are changes in the stream channel at a site (such as scouring of the channel bed or vegetation growth) sufficient to cause a departure from the rating curve. The change is detected by plotting the most recent direct measurement of discharge on the rating curve. When the most recent direct measurement does not plot on the rating curve, the curve is shifted or modified to define current measurement conditions. The stage and discharge are measured with some uncertainty, and the rating curve is constructed with uncertainty. These sources of uncertainty affect how shifts in the rating curve are applied, and they determine the confidence limits of the stage and streamflow data. In NSIP, statistical methods of uncertainty analysis will be used to assist with quality control, construction of rating curves, determination of rating-curve shift applications, and quantification of confidence limits on stage and streamflow data.
Quality-assurance techniques assess the uncertainties in stage measurements, direct discharge measurements, and rating curves to ensure the accuracy and to quantify the uncertainty of streamflow information. In NSIP, these analyses will be performed in four phases corresponding to the timings of data availability. (See Appendix C in Section 13.) Timings are referenced to reporting intervals that delimit reporting times by direct measurements. Currently, reporting intervals are about 6 weeks long. A preliminary phase of quality assurance will assess the adequacy of real-time stage data for computing streamflow records. If stage data meet quality assurance criteria, then the stage data will be passed to subsequent phases for use in streamflow computation. Otherwise, a quality alert will be generated and a model-based estimate of streamflow may be computed. An initial phase of quality assurance will compute an estimate of streamflow during an open reporting interval in which a direct measurement is available only prior to the reporting time. An intermediate phase will update the initial estimate when a second direct measurement becomes available following the reporting time. The final phase of quality assurance will update intermediate values and incorporate model-based information using direct measurements available before and after the reporting time at all streamgaging stations in an integrated network of streamgages.
Reston, Va., Menlo Park, Calif., Sioux Falls, S.D., and Denver, Colo. are good candidate sites for Data Access Centers because of high-speed network connections within DOINET and to the Internet beyond the DOINET. Duplication of databases, software, and functionality at data-serving sites creates a reliable system for providing streamflow information. Three of the four sites could go "offline", and streamflow information still could be provided in near real-time over the Internet. The Data Access Centers are intentionally located away from the Data Processing Centers, in order to shield the Data Processing Centers from Internet traffic at the Data Access Centers.
The data routing components will receive data from the Data Processing Centers in real-time and transmit data to the Data Access Centers. The routing system also will be responsible for adding new sets of finalized data to the data archival system. The routing component will manage the transmission of streamflow information through the Database System, ensuring that all data sets are current and that sites have streamflow records that are consistent with their duplicates. The routing component will have the additional purpose of keeping each Data Processing Center from needing knowledge of any other Data Processing Center, access database, or archival database. The processing and access centers need only know the identities of the routing sites. The routing component needs to know the identities of all other components in the Database System, including other routing components.
The routing system component of the Database System contains no permanent set of streamflow data and is not responsible for responding to any user queries. It stores only the latest updates of the real-time data record and tracks the updates of all components. Once all access databases, Data Processing Centers and other routing components have been updated with a portion of the streamflow record, that portion of the record is discarded by the routing components. When an access database or processing center goes off-line, the routing component recognizes this the first time that it attempts to update that site. The routing component will then accumulate the streamflow record until the site is back on-line and is successfully updated.
In the design of a network collection of databases, a distinction is made between a source database "pushing" information to a destination database and a destination database "pulling" information from the source database. Because real-time streamflow information is received from the data collection platforms and is modified by USGS hydrographers at irregular intervals, the destination (access) databases can be kept current most efficiently when information is pushed from the source (processing) databases. Information will be pushed from a processing center as a reaction to receipt of new data from the collection platforms or an edit of the streamflow record by a hydrographer. If pull technology were to be used, access databases would periodically check for updates, but would not react to update events. This would result in an unneeded lag in the real-time delivery of information to the Data Access Centers. An additional benefit of developing the Database System with "push" technology is the ability to deliver, in real-time, information to the computers of customers such as the National Weather Service, the U.S. Army Corps of Engineers, or the Bureau of Reclamation, who need current streamflow information.
The data archiving system will store the final streamflow record. The primary archive maintains data stored at the measurement interval; derivative archive databases contain processed forms of the primary record, such as daily values. Archival databases will be updated whenever data are finalized. The access database components contain data in forms that are most suitable for data users for the full period of record, including both the historical and provisional data.
Technology that may be used to increase reliability of individual database sites includes Redundant Arrays of Inexpensive Disks (RAIDs), cluster server technologies, and Uninterrupted Power Supplies (UPSs). When a computer system has RAID hardware, it has twice as many disks as needed. This allows each piece of data to be stored on (at least) two separate disks. This redundancy is managed by the operating system and is hidden from the database software. If the first disk on which a piece of data was stored were to become unavailable during a query, then the operating system would automatically switch to the second disk. The database software and the customer would be unaware that a piece of hardware has just failed. Cluster-server technology is the software analogue of RAIDs. If the operating system, web server, or even an entire computer were to experience shutdown, then processing would automatically shift to another computer in the cluster with no significant delay to the customer. Multiple servers can be arranged in a cluster and share the management of a common RAID. The Microsoft TerraServer (http://terraserver.microsoft.com), which employs both of these technologies, has never been off-line despite having had seven separate disk failures. UPSs simply put the hardware platform on a battery, isolating the site from any irregularities in the normal power supply. If the normal power supply is temporarily stopped, UPSs can allow a platform to remain on-line for limited periods of time.
Redundant processing databases will be housed in physically separate locations with independent data feeds, because an individual site can never be totally failure-tolerant. A primary processing center would be responsible for forwarding data to the routing component. If the primary center experienced a shutdown, then the secondary processing center site would be called on to forward data to the routing database(s). Redundant routing databases will also be maintained to ensure that data are being pushed out to the access databases. Similar twinning of the archival and access databases also will be implemented. In addition to providing backup for the primary site in the case of a failure in the database system, this redundancy allows the network traffic and computer processing burdens to be spread across the USGS and DOINET infrastructure.
The preliminary phase will quality assure real-time stage data. Stage data will be checked for errors in timing and pass through a series of mathematical filters (fig 1) to detect other likely sources of error. As a minimum, the filters will detect whether stage data (1) are within the range of historical values or limits specified by the hydrographer, (2) have fewer than the maximum number of repetitive stage values likely for the stage dynamics at the specific site, and (3) have rates of change for rising and falling stages that are within specified limits. Stage data that meet the quality assurance criteria will be used for initial estimation of streamflow. Otherwise, a quality alert will be automatically generated within the Data Processing Center for evaluation.
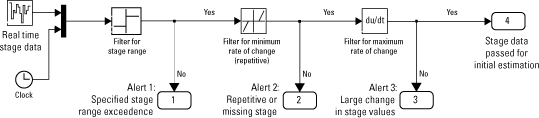
Figure 1. Process for quality assuring stage data.
Procedures will be developed to reconcile quality alerts. The quality alert may trigger a decision to repair instrumentation, conduct a direct measurement, or revise the alert thresholds. Cost effective reconciliation of the alerts may require the establishment of a network of local Water Watchers (Section 4.4), where needed, for remote, troublesome, or particularly critical streamgages. In addition, the quality alert may identify real-time data on the Internet that is flagged by an alert as "Under Review." In some cases, the alert may be used to automatically switch the basis for real-time streamflow information from stage-based "Initial" estimates to model-based "Preliminary" estimates.
Preliminary streamflow information will be based on a mathematical model of the dynamic interrelation among streamflows in a network of two or more streamgaging stations (fig 2). The model will be identified and associated parameters will be estimated by use of historical data. During periods when one or more streamgaging stations in the network have stage that do not meet quality-assurance criteria, the model will simulate streamflow by use of hydrologic data from the remaining stations. Simulations will provide streamflow data and uncertainty intervals that continuously adjust to information provided by direct streamflow measurements. Where available, precipitation and temperature data may be used to improve the accuracy of model estimates.
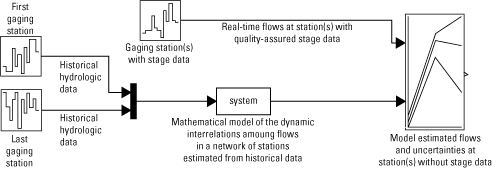
Figure 2. Mathematical model for simulating streamflow at streamgaging stations where stage data does not meet quality-assurance criteria.
Initial estimates of streamflow will be based on site- and event-specific conditions that influence the accuracy of stage data, the rating curve, and the direct measurement defining the beginning of the reporting interval. Uncertainty in the stage data will be assessed based on the precision of the stage-monitoring device and the conditions of its deployment. In addition, the sensitivity of the stage-discharge relation to errors in stage measurements will be assessed based on the local slope of the rating curve. Stages at which the rating curve has a steeper slope will be assessed a lower sensitivity than parts of the rating where the slope is relatively flat.
The stage-dependent uncertainty in the rating will be estimated by fitting a set of local quadratic functions to the stage and discharge data defining the rating. The weighting function providing the local approximation will be determined based on the distribution of stage measurements. Standard errors of the regression will be computed at each direct measurement. These errors will be interpolated between the minimum and maximum measurements to define a confidence interval. The standard error of the regression and confidence intervals for streamflow conditions outside the part of the rating defined by direct measurements will be computed based on the local regression equation fitting the extreme measurements.
Uncertainty of the direct discharge measurement will be quantified by use of bootstrap (re-sampling) techniques. Specifically, a set of estimates of the direct measurement of discharge will be computed by systematically withholding one or more vertical subsections used to compute discharge. Analysis of the distribution of the ensemble of these estimates will provide a basis for assessing the uncertainty of the direct measurement. This estimate of uncertainty will be compared with the hydrographer's qualitative field assessment of the measurement accuracy.
Quantifying the uncertainty of the rating and the first direct measurement in the reporting interval will provide a basis for computing an initial shift. A shift is a temporary departure in the hydraulic control described by the rating. Shifts may be caused by sudden changes in channel geometry associated with a specific streamflow event or it may be a gradual change in flow resistance associated with vegetative growth. Because of the uncertainties in both the rating and the direct measurement, the best estimate of the shift magnitude (fig. 3) will be computed as the minimum variance estimate. The minimum variance estimate involves a standard computation that weights the apparent shift, indicated by the direct measurement, with the rating in inverse proportion to their corresponding variances. Once the minimum variance estimate is computed, the hydrographer provides stage (spatial) limits on the applicability of the shift based on the hydraulic characteristics of the site and the mechanism causing the shift. The temporal component of the shift will be projected forward in time as a constant, applied to the standard rating, and used with real-time data to compute initial estimates of streamflow and uncertainties for distribution on the Internet (Fig. 4).
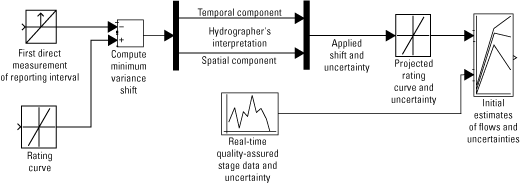
Figure 3. Process for computing initial streamflow estimates.
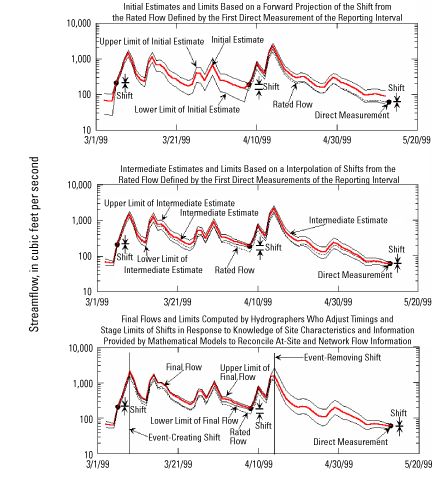
Figure 4. Hydrograph showing relation between shifts in the rated streamflow defined by direct measurements, initial and intermediate estimates, and final streamflow computations.
A direct measurement defining the end of the reporting interval provides additional information about shift characteristics and streamflow throughout the reporting interval (fig 4). The minimum variance shift computed at the end of the reporting interval will be used to refine (by interpolation) the shift projected at the beginning of the reporting interval. In addition, information provided by the last direct measurement will be used to re-evaluate the stage limits (spatial component) of the shift defined by the hydrographer at the beginning of the interval. The additional information will be used to update the initial estimate of streamflow and reduce the uncertainty of the estimate. The intermediate estimates will be posted to the Internet shortly after the last measurement of the reporting (fig. 5).
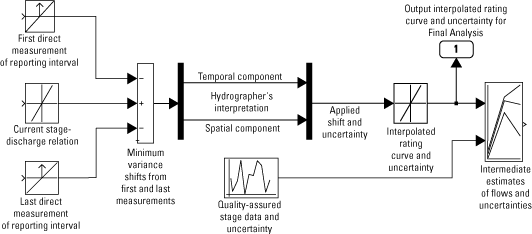
Figure 5. Process for computing the intermediate estimates of streamflow.
The final phase reconciles site-specific streamflow information with data provided by a network of integrated streamgaging stations. This phase of the analysis provides an opportunity for the hydrographer to adjust the timings of shifts from the times of direct measurements to the times of their likely occurrence. These adjustments generally require an analysis of records from more than one streamgaging station to assist in the identification of shifts and to ensure conservation of streamflow and consistency of information throughout the streamgaging network. During this phase, the hydrographer also may refine the stage limits through which the shifts are applicable and update preliminary estimates of streamflow computed for periods of missing stage record.
In the past, the final phase of this analysis was successfully completed by inspection and comparison of hydrographs from two or more closely related streamgaging stations. Although this technique has resulted in high quality streamflow records, the process is subjective, time consuming, and delays information availability. New techniques are needed to assist the integration of streamflow information from stations in a network while maintaining the flexibility to account for subjective data required for their implementation. Such a technique will be based on the mathematical model utilized in the preliminary phase to estimate streamflow during periods of missing stage record. The model also will be applicable to many USGS streamgaging stations in the northern and midwestern tier of States that regularly experience ice-affected streamflow conditions during extended winter periods, such as the Kalman filter developed by Holtschlag and Grewal (1998).
As part of the final phase, a dynamic model of the historical interrelations among streamflows in a network of streamgaging stations will be simulated. Discrepancies between simulated and intermediate streamflows will be computed (fig. 6). To improve sensitivity, the cumulative sum of discrepancies (rather than the discrepancies themselves) will be analyzed to determine the timings of shifts, and whether shifts are abrupt (event related) or gradual (seasonal). Time-series plots of the cumulative discrepancies will be inspected, standard quality-assurance techniques (Box and Luceno, 1997) will be used, and other mathematical techniques will be applied to detect systematic divergences between simulated and intermediate streamflows. Hydrographers will develop final shifts based on their field experience and evidence provided by model results. The shifts will be applied and streamflows posted on the Internet will be updated from "Intermediate" to "Final" shortly after data from streamgaging stations are available to close the reporting interval for all streamgaging stations in the network. Uncertainty estimates will be provided for the final streamflow information.
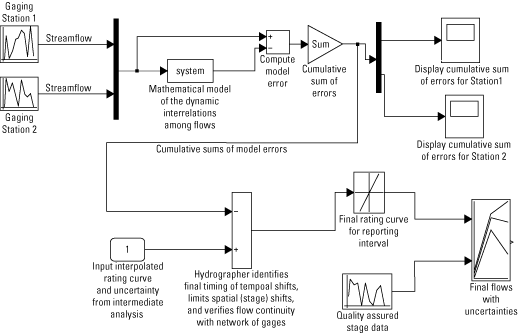
Figure 6. Process for finalizing streamflow information by use of streamflow data from networks of stations and models of interrelated streamflow dynamics.
This report is available online in Portable Document Format (PDF). If you do not have the Adobe Acrobat PDF Reader, it is available for free download from Adobe Systems Incorporated.
Download the report (PDF, 1.7 MB )
Document Accessibility: Adobe Systems Incorporated has information about PDFs and the visually impaired. This information provides tools to help make PDF files accessible. These tools convert Adobe PDF documents into HTML or ASCII text, which then can be read by a number of common screen-reading programs that synthesize text as audible speech. In addition, an accessible version of Acrobat Reader 5.0 for Windows (English only), which contains support for screen readers, is available. These tools and the accessible reader may be obtained free from Adobe at Adobe Access.
| AccessibilityFOIAPrivacyPolicies and Notices | |
 |
|