
Slack, John F. , Schmidt, Jeanine M. , and Dumoulin, Julie A. , 2004, Whole Rock Geochemical Data For Paleozoic Sedimentary Rocks of the western Brooks Brooks Range, Alaska: U.S. Geological Survey Open-File Report 2004-1371, U.S. Geological Survey, Reston, VA.Online Links:
This is a Point data set. It contains the following vector data types (SDTS terminology):
Horizontal positions are specified in geographic coordinates, that is, latitude and longitude. Latitude and longitude values are specified in decimal degrees.
The horizontal datum used is North American Datum of 1927.
The ellipsoid used is Clarke 1866.
The semi-major axis of the ellipsoid used is 6378206.4.
The flattening of the ellipsoid used is 1/294.98.
Textual identifier without further scientific significance
| Value | Definition |
|---|---|
| Hunt Fork Shale | |
| Kanayut Conglomerate | |
| Kayak Shale | |
| Kuna Formation | |
| Kuna Formation (Kivalina unit) | |
| Lisburne Group (drowned shelf facies) | |
| Lisburne Group (shelf facies) | |
| Lisburne Group (Zebra Creek facies) | |
| Noatak Sandstone | |
| Siksikpuk Formation |
Plain descriptive text
| Value | Definition |
|---|---|
| Drill core | |
| Outcrop |
| Range of values | |
|---|---|
| Minimum: | 63.38107 |
| Maximum: | 68.63448 |
| Range of values | |
|---|---|
| Minimum: | -163.89995 |
| Maximum: | -151.8644 |
| Value | Definition |
|---|---|
| Activation Laboratories | |
| U.S. Geological Survey |
| Range of values | |
|---|---|
| Minimum: | 5.42 |
| Maximum: | 97.63 |
| Range of values | |
|---|---|
| Minimum: | 0.009 |
| Maximum: | 1.18 |
| Range of values | |
|---|---|
| Minimum: | 0.16 |
| Maximum: | 23.6 |
| Range of values | |
|---|---|
| Minimum: | 0.07 |
| Maximum: | 45.8 |
| Units: | percent by weight |
| Range of values | |
|---|---|
| Minimum: | 0 |
| Maximum: | 1.016 |
| Units: | percent by weight |
| Range of values | |
|---|---|
| Minimum: | 0.02 |
| Maximum: | 15.11 |
| Units: | percent by weight |
| Range of values | |
|---|---|
| Minimum: | 0.01 |
| Maximum: | 51.09 |
| Units: | percent by weight |
| Range of values | |
|---|---|
| Minimum: | 0.02 |
| Maximum: | 1.97 |
| Units: | percent by weight |
| Range of values | |
|---|---|
| Minimum: | 0.06 |
| Maximum: | 4.28 |
| Units: | percent by weight |
| Range of values | |
|---|---|
| Minimum: | 0.02 |
| Maximum: | 30.91 |
| Units: | percent by weight |
| Value | Definition |
|---|---|
| n.a. | no analytic result available |
| Range of values | |
|---|---|
| Minimum: | 0 |
| Maximum: | 39.04 |
| Units: | percent by weight |
| Range of values | |
|---|---|
| Minimum: | 57.06 |
| Maximum: | 99.77 |
| Units: | percent by weight |
| Value | Definition |
|---|---|
| n.a. | no analytic result available |
| Range of values | |
|---|---|
| Minimum: | 0.005 |
| Maximum: | 6.43 |
| Units: | percent by weight |
| Value | Definition |
|---|---|
| n.a. | no analytic result available |
| Range of values | |
|---|---|
| Minimum: | 0.01 |
| Maximum: | 23.2 |
| Units: | percent by weight |
| Value | Definition |
|---|---|
| n.a. | no analytic result available |
| Range of values | |
|---|---|
| Minimum: | 0.01 |
| Maximum: | 38 |
| Units: | percent by weight |
| Value | Definition |
|---|---|
| n.a. | no analytic result available |
| Range of values | |
|---|---|
| Minimum: | 0.02 |
| Maximum: | 22.38 |
| Units: | percent by weight |
| Value | Definition |
|---|---|
| n.a. | no analytic result available |
| Range of values | |
|---|---|
| Minimum: | 0.01 |
| Maximum: | 4.06 |
| Units: | percent by weight |
| Value | Definition |
|---|---|
| n.a. | no analytic result available |
| Range of values | |
|---|---|
| Minimum: | 0.05 |
| Maximum: | 4.55 |
| Units: | percent by weight |
| Range of values | |
|---|---|
| Minimum: | 1 |
| Maximum: | 256 |
| Units: | ppm (parts per million by weight) |
| Range of values | |
|---|---|
| Minimum: | 0.1 |
| Maximum: | 53.6 |
| Units: | ppm (parts per million by weight) |
| Range of values | |
|---|---|
| Minimum: | 9 |
| Maximum: | 1900 |
| Resolution: | 1 |
| Range of values | |
|---|---|
| Minimum: | 39 |
| Maximum: | 39500 |
| Resolution: | 1 |
| Range of values | |
|---|---|
| Minimum: | 1.5 |
| Maximum: | 339.8 |
| Units: | ppm (parts per million by weight) |
| Range of values | |
|---|---|
| Minimum: | 1.61 |
| Maximum: | 170.09 |
| Units: | ppm (parts per million by weight) |
| Range of values | |
|---|---|
| Minimum: | 1.46 |
| Maximum: | 165 |
| Units: | ppm (parts per million by weight) |
| Value | Definition |
|---|---|
| n.a. | no analytic result available |
| Range of values | |
|---|---|
| Minimum: | 0.38 |
| Maximum: | 30.79 |
| Units: | ppm (parts per million by weight) |
| Range of values | |
|---|---|
| Minimum: | 1.47 |
| Maximum: | 133.15 |
| Units: | ppm (parts per million by weight) |
| Range of values | |
|---|---|
| Minimum: | 0.25 |
| Maximum: | 39.9 |
| Units: | ppm (parts per million by weight) |
| Value | Definition |
|---|---|
| n.a. |
| Range of values | |
|---|---|
| Minimum: | 0.028 |
| Maximum: | 9.78 |
| Units: | ppm (parts per million by weight) |
| Value | Definition |
|---|---|
| n.a. | no analytic result available |
| Range of values | |
|---|---|
| Minimum: | 0.24 |
| Maximum: | 30.01 |
| Units: | ppm (parts per million by weight) |
| Range of values | |
|---|---|
| Minimum: | 0.03 |
| Maximum: | 5.98 |
| Units: | ppm (parts per million by weight) |
| Value | Definition |
|---|---|
| n.a. | no analytic result available |
| Range of values | |
|---|---|
| Minimum: | 0.22 |
| Maximum: | 31.58 |
| Units: | ppm (parts per million by weight) |
| Value | Definition |
|---|---|
| n.a. | no analytic result available |
| Range of values | |
|---|---|
| Minimum: | 0.05 |
| Maximum: | 6.81 |
| Units: | ppm (parts per million by weight) |
| Value | Definition |
|---|---|
| n.a. | no analytic result available |
| Range of values | |
|---|---|
| Minimum: | 0.18 |
| Maximum: | 23.74 |
| Units: | ppm (parts per million by weight) |
| Value | Definition |
|---|---|
| n.a. | no analytic result available |
| Range of values | |
|---|---|
| Minimum: | 0.03 |
| Maximum: | 4.118 |
| Units: | ppm (parts per million by weight) |
| Range of values | |
|---|---|
| Minimum: | 0.13 |
| Maximum: | 25 |
| Units: | ppm (parts per million by weight) |
| Range of values | |
|---|---|
| Minimum: | 0.02 |
| Maximum: | 4.222 |
| Units: | ppm (parts per million by weight) |
| Range of values | |
|---|---|
| Minimum: | 0.0877 |
| Maximum: | 1.3357 |
| Units: | (ratio, no units) |
| Range of values | |
|---|---|
| Minimum: | 0.2138 |
| Maximum: | 0.9055 |
| Units: | (ratio, no units) |
| Range of values | |
|---|---|
| Minimum: | 5 |
| Maximum: | 621 |
| Units: | ppm (parts per million by weight) |
| Range of values | |
|---|---|
| Minimum: | 0.1 |
| Maximum: | 14.8 |
| Units: | ppm (parts per million by weight) |
| Range of values | |
|---|---|
| Minimum: | 0.1 |
| Maximum: | 20.5 |
| Units: | ppm (parts per million by weight) |
| Range of values | |
|---|---|
| Minimum: | 0.01 |
| Maximum: | 1.9 |
| Units: | ppm (parts per million by weight) |
| Range of values | |
|---|---|
| Minimum: | 0.22 |
| Maximum: | 21.78 |
| Units: | ppm (parts per million by weight) |
| Range of values | |
|---|---|
| Minimum: | 0.58 |
| Maximum: | 162.12 |
| Units: | ppm (parts per million by weight) |
| Range of values | |
|---|---|
| Minimum: | 15 |
| Maximum: | 1720 |
| Units: | ppm (parts per million by weight) |
| Range of values | |
|---|---|
| Minimum: | 0.5 |
| Maximum: | 27.1 |
| Units: | ppm (parts per million by weight) |
| Range of values | |
|---|---|
| Minimum: | 8 |
| Maximum: | 1690 |
| Units: | ppm (parts per million by weight) |
| Range of values | |
|---|---|
| Minimum: | 0 |
| Maximum: | 49 |
| Units: | ppm (parts per million by weight) |
| Range of values | |
|---|---|
| Minimum: | 8 |
| Maximum: | 621 |
| Units: | ppm (parts per million by weight) |
| Range of values | |
|---|---|
| Minimum: | 2 |
| Maximum: | 88 |
| Units: | ppm (parts per million by weight) |
| Range of values | |
|---|---|
| Minimum: | 7 |
| Maximum: | 590 |
| Units: | ppm (parts per million by weight) |
| Range of values | |
|---|---|
| Minimum: | 4 |
| Maximum: | 1300 |
| Units: | ppm (parts per million by weight) |
| Value | Definition |
|---|---|
| n.a. | no analytic result available |
| Range of values | |
|---|---|
| Minimum: | 0.3 |
| Maximum: | 100 |
| Units: | ppm (parts per million by weight) |
| Range of values | |
|---|---|
| Minimum: | 2 |
| Maximum: | 180 |
| Units: | ppm (parts per million by weight) |
| Range of values | |
|---|---|
| Minimum: | 0.1 |
| Maximum: | 32.1 |
| Units: | ppm (parts per million by weight) |
| Value | Definition |
|---|---|
| n.a. | no analytic result available |
| Range of values | |
|---|---|
| Minimum: | 2 |
| Maximum: | 34 |
| Units: | ppb (parts per billion by weight) |
| Range of values | |
|---|---|
| Minimum: | 1 |
| Maximum: | 33 |
| Units: | ppm (parts per million by weight) |
| Value | Definition |
|---|---|
| n.a. | no analytic result available |
| Range of values | |
|---|---|
| Minimum: | 0 |
| Maximum: | 4.99 |
| Units: | ppm (parts per million by weight) |
| Value | Definition |
|---|---|
| n.a. | no analytic result available |
| Range of values | |
|---|---|
| Minimum: | 0.03 |
| Maximum: | 1.84 |
| Units: | ppm (parts per million by weight) |
| Range of values | |
|---|---|
| Minimum: | 0.1 |
| Maximum: | 19 |
| Units: | ppm (parts per million by weight) |
| Range of values | |
|---|---|
| Minimum: | 0.5 |
| Maximum: | 68.2 |
| Units: | ppm (parts per million by weight) |
| Range of values | |
|---|---|
| Minimum: | 0.08 |
| Maximum: | 3.4 |
| Units: | ppm (parts per million by weight) |
| Value | Definition |
|---|---|
| n.a. | no analytic result available |
| Range of values | |
|---|---|
| Minimum: | 1 |
| Maximum: | 44 |
| Units: | ppm (parts per million by weight) |
| Range of values | |
|---|---|
| Minimum: | 1 |
| Maximum: | 7 |
| Units: | ppm (parts per million by weight) |
| Value | Definition |
|---|---|
| n.a. | no analytic result available |
| Range of values | |
|---|---|
| Minimum: | 0.5 |
| Maximum: | 16.1 |
| Units: | ppm (parts per million by weight) |
| Range of values | |
|---|---|
| Minimum: | 1 |
| Maximum: | 3 |
| Units: | ppm (parts per million by weight) |
| Value | Definition |
|---|---|
| n.a. | no analytic result available |
| Range of values | |
|---|---|
| Minimum: | 3 |
| Maximum: | 200 |
| Units: | ppm (parts per million by weight) |
| Value | Definition |
|---|---|
| n.a. | no analytic result available |
| Range of values | |
|---|---|
| Minimum: | 0.5 |
| Maximum: | 36 |
| Units: | ppb (parts per billion by weight) |
I.L. Tailleur and J.M. Kurtak donated phosphorite samples for analysis.
703-648-6337 (voice)
703-648-6383 (FAX)
jfslack@usgs.gov
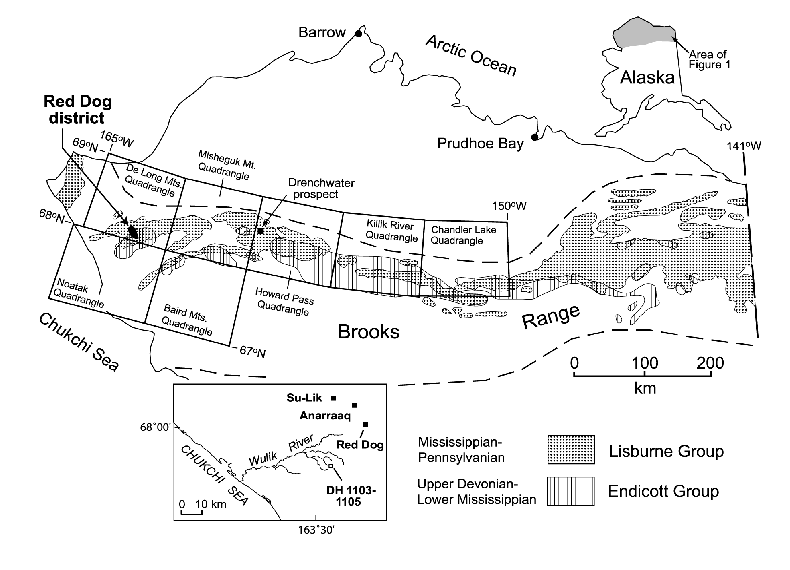
These data form the basis for a study by Slack et al. (2004a) on the provenance and depositional history of the Paleozoic strata, and on their metallogenic significance relative to the formation of large stratabound Zn-Pb-Ag deposits in the Red Dog mining district.
Slack, John F. , Kelley, Karen D. , and Clark, Jeffrey L. , 2004, Whole rock geochemical data for altered and mineralized rocks, Red Dog Zn-Pb-Ag district, western Brooks Range, Alaska: U.S. Geological Survey Open-File Report 2004-1372, U.S. Geological Survey, Reston, VA.Online Links:
Precision and accuracy for concentrations 100x the minimum detection limit (MDL) was generally better than ±5 % relative, and in many cases such as for major elements was better than ±1 % relative. For concentrations approximately 10x the MDL, precision and accuracy were about ±10-20 % relative depending on the method used.
Data are available for most elements in most samples. The code "n.a." is used to indicate an unavailable analysis; it occurs in only 21 fields:
Database
field                  Percent   Chemical
label     # missing    missing   species
-----------------------------------------
LOI          65          30%      (loss on ignition)
F            50          23%      F
TOTAL_C       3           1%      (total carbon)
CO2          31          14%      (carbon dioxide)
CORG         31          14%      (organic carbon)
S            30          14%      S
SO4          63          30%      (sulfate)
PR           66          31%      Pr
GD           66          31%      Gd
DY           66          31%      Dy
HO           66          31%      Ho
ER           66          31%      Er
TM           66          31%      Tm
CD          110          52%      Cd
AU           23          10%      Au
GE           65          30%      Ge
TL           66          31%      Tl
SE           23          10%      Se
W            66          31%      W
LI          103          49%      Li
PD          121          57%      Pd
Multiple standards were analyzed together with the submitted rock samples. Analyses by ACT Labs included data on 8 to 10 compositionally different standards with well-defined elemental concentrations. In addition to these standards, analyses were routinely obtained on duplicate samples and Ohio black shale SDO-1 (<http://minerals.cr.usgs.gov/geochem/ohioshale.html>).
Are there legal restrictions on access or use of the data?
- Access_Constraints: none
- Use_Constraints: none
1-888-ASK-USGS (voice)
303-202-4693 (FAX)
ask@usgs.gov
USGS Open-File Report 2004-1371
Although all data published in these grids have been used by the USGS, no warranty, expressed or implied, is made by the USGS as to the accuracy of the data and related materials. The act of distribution shall not constitute any such warranty, and no responsibility is assumed by the USGS in the use of these data or related materials. Any use of trade, product, or firm names is for descriptive purposes only and does not imply endorsement by the U.S. Government.
| Data format: | Sample point locations and geochemical analyses in format Shapefile (version 1.0) Size: 34 kilobytes |
|---|---|
| Network links: |
<http://pubs.usgs.gov/of/2004/1371/gisdata.zip> |
| Data format: | Sample point locations and geochemical analyses in format Microsoft Excel (version 97) Size: 185 kilobytes |
|---|---|
| Network links: |
<http://pubs.usgs.gov/of/2004/1371/brooks.xls> |
(703) 648-6533 (voice)
(703) 648-6560 (FAX)
<pschweitzer@usgs.gov>