Discussion
The data within the coastal change-potential index (CPI) show variability at different spatial scales (fig. 13). However, the ranked values for the physical process variables vary less over the extent of the shoreline. The value of the relative sea-level rise variable is constant at very low change-potential for the entire study area. The significant wave height change-potential is low to high. The tidal range is moderate change-potential (2.0- 4.0 m) for all of Kenai Fjords NP.
The geologic variables show the most variability and thus have the most influence on the CPI (fig. 13). Geomorphology in the park includes very high change-potential sandy beach shoreline, high change-potential gravel beaches, moderate change-potential alluvial fans and glacial landforms, low and very low change-potential rock and cliff features (fig. 6A-G and fig. 7). Change-potential based on shoreline change estimates varies from low to high (fig. 6A-E). Regional coastal slope is in the very low to very high change-potential range for Kenai Fjords NP.
The most influential variables in the CPI are geomorphology, shoreline change-potential, coastal slope, and wave energy; therefore, they may be considered the most important variables controlling how Kenai Fjords will evolve as sea level changes.
|
Click on figure for larger image.
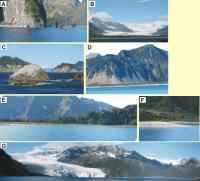 |
Figure 6. Seven ground photographs of representative coastal landforms within Kenai Fjords National Park.
|
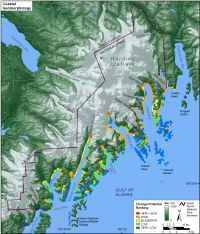 |
Figure 7. Coastal geomorphology for Kenai Fjords National Park.
|
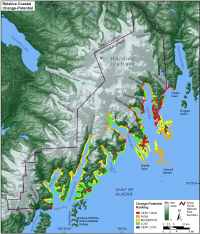 |
Figure 13. Relative coastal change-potential for Kenai Fjords National Park.
|
|