
Relative Coastal Change-Potential Assessment of Kenai Fjords National Park
USGS Open-File Report 2004-1373
|
Relative Coastal Change-Potential Assessment of Kenai Fjords National Park USGS Open-File Report 2004-1373 |
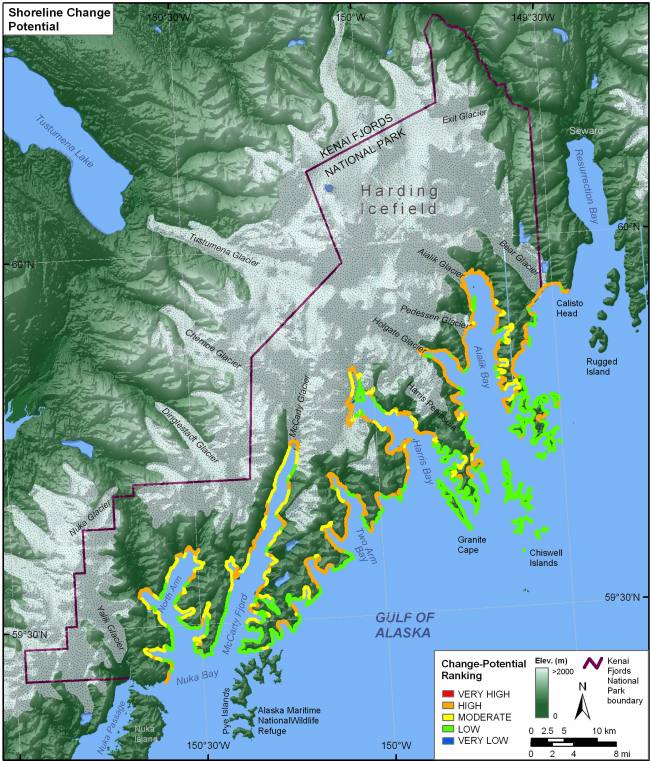
Figure 8. Shoreline change-potential for Kenai Fjords National Park. The colored shoreline represents the estimated potential for shoreline erosion or accretion. Shoreline change-potential for Kenai Fjords range from low change-potential (areas not likely to experience significant shoreline change annually) to high change-potential (areas where shoreline change will likely occur within one year). | ||
 |
||
