Physical Process Variables
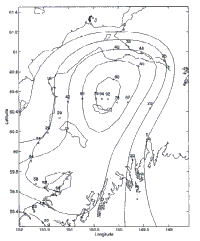
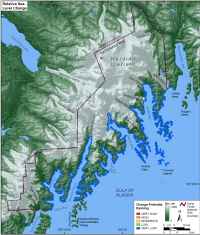
The relative sea-level change variable is derived from the change in annual mean water elevation over time as measured at tide gage stations along the coast. The rate of sea-level change for Seward, AK is -1.46 + 0.67 mma-1 based on 36 years of data since the Good Friday Earthquake of 1964 (Zervas, 2001). This variable inherently includes both eustatic sea-level change (addition of glacier meltwater and static increase in volume) as well as regional sea-level change caused by isostatic and tectonic adjustments of the land surface. Relative sea-level change data are limited to the historical record, and thus portray only the recent sea-level trend (<150 years). Relative sea-level change for Kenai Fjords NP falls within very low change-potential based on water elevation data at Seward, AK (fig. 10).
Kenai Peninsula is still experiencing complex post-seismic tectonic uplift from the 1964 Good Friday Earthquake. Uplift in some areas on the western edge of the Kenai Peninsula experienced rates near 30 mma-1 in the early decades following the earthquake (Cohen and Freymeuller, 2001) (fig. 4). However, such high rates of uplift are not expected to persist, and GPS measurements between 1993 and 1995 recorded uplift to be comparatively small and likely due to steady plate convergence rather than continued post-seismic tectonic rebound (Cohen and Freymeuller, 1997; 2001). For this reason and also because of the documented suspect tide gage data at Nikiski, AK, all of Kenai Fjords NP sea-level data were mapped to the gage at Seward, AK (Zervas, 2001; Cohen and Freymeuller, 1997). Other tide gages, such as Kodiak Island, Seldovia, and Valdez are significantly further from the study area and likely influenced by tectonic processes that are likely not relevant to tectonic processes within Kenai Fjords NP.
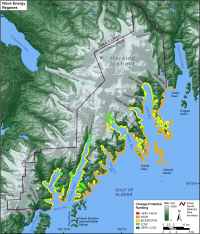
Mean significant wave height is used here as a proxy for wave energy which drives coastal sediment transport. Wave energy is directly related to wave height
E = 1/8 ρgH2
where E is energy density, H is wave height, ρ is water density and
g is acceleration due to gravity. Thus, the ability to mobilize and transport coastal sediments is a function of wave height squared. Recorded significant wave height values are used for this variable where available. However, significant wave height data were not available for all parts of Kenai Fjords National Park, so a wave energy regime database produced by the USGS and available through NPS was used instead (Mann 1995; Crowell and Mann, 1995) (http://www.nps.gov/akso/gis/). For Kenai Fjords NP, areas in low wave-energy regimes were assigned low change-potential, while moderate wave-energy regimes were assigned moderate change-potential, and high wave-energy regimes were classified as high change-potential (fig. 11).
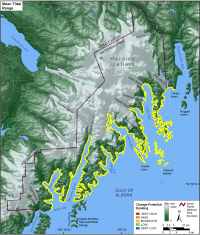
Tidal range is linked to both permanent and episodic inundation hazards. Tide-range data were obtained from NOAA/NOS published benchmarks from Resurrection Bay, Agnes Cove, Bear Cove, North Aialik, Aialik Sill, Camp Cove, and Crater Bay. All mean tidal ranges fell between 2.54 and 2.87 m, therefore classified as moderate change-potential (2.0 - 4.0 meters) with respect to tidal range (fig. 12).