Results
The CPI values calculated for Kenai Fjords range from 1.14 to 12.65. The mean CPI value is 4.09; the mode is 4.90 and median is 4.00. The standard deviation is 1.76. The 25th, 50th, and 75th percentiles are 2.9, 4.1 and 4.75, respectively.
Figure 13 shows a map of the coastal change-potential index for Kenai Fjords National Park. The CPI scores are divided into low, moderate, high, and very high-change-potential categories based on the quartile ranges and evaluation of the data. CPI values < 2.9 are assigned to the low change-potential category. Values from 2.9 to 4.1 are considered moderate change-potential. High change-potential values are between 4.2 and 4.75. CPI values above 4.75 are classified as very high change-potential. Figure 14 shows the percentage of Kenai Fjords shoreline in each change-potential category. Nearly 700 km (430 miles) of shoreline is evaluated along the Kenai Fjords NP shoreline. Of this total, seventeen percent of the mapped shoreline is classified as being at very high change-potential with respect to future sea-level change. Thirty-five percent is classified as high change-potential, twenty-five percent as moderate change-potential, and twenty-three percent as low change-potential.
| |
Click on figure for larger image.
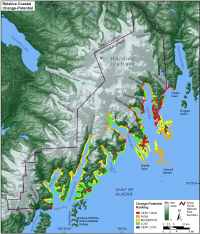 |
| Figure 13. Relative coastal change-potential for Kenai Fjords National Park. |
|
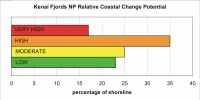 |
| Figure 14. Percentage of Kenai Fjords NP shoreline in each CPI category. |
|
|