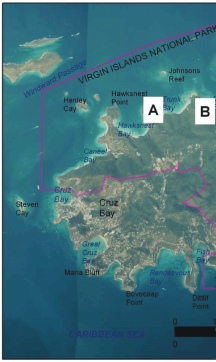
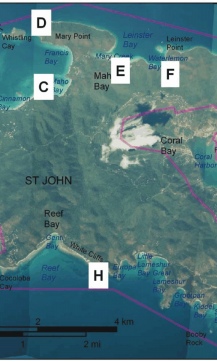
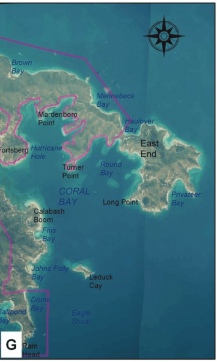
Link to Figure 5A. Link to Figure 5B. Link to Figure 5G. link to Figure 5d. Link to Figure 5C. Link to Figure 5E. Link to Figure 5F Link to Figure 5H. U.S. Geological Survey Open-File Report 2004-1398, Coastal Vulnerability Assessment of Virgin Islands National Park (VIIS) TO Sea-Level Rise , Figure 5, Photos of different geomorphology types within Virgin Islands National Park.
Skip past header information
USGS Logo with link to USGS Web page
Coastal Vulnerability Assessment of Virgin Islands National Park to Sea-Level Rise, USGS Open-File Report 2004-1398

Back to Title Page

Figure 5.   Photos of different geomorphologic types within Virgin Islands National Park. Click on a letter to see a photo near that location.

A) A view of Trunk Bay from the east, very high vulnerability.
B) The shoreline at Cinnamon Bay is experiencing erosion, very high vulnerability.
C) A view of Maho Bay from the east, very high vulnerability.
D) Mary Point was ranked as low vulnerability (photo by Rebecca Beavers).
E) The Annaberg Mill ruins are in an area ranked as high vulnerability with respect to geomorphology (photo by Rebecca Beavers).
F) The shoreline surrounding Waterlemon Bay is a cobble beach, high vulnerability
G) Ram Head is a rocky headland, low vulnerability (photo by Rebecca Beavers). H) The white cliffs near Reef Bay were ranked as low vulnerability (photo by Rebecca Beavers).


Figure 5.     Photos of different geomorphology types within Virgin Islands National Park. Figure 5.     Photos of different geomorphology types within Virgin Islands National Park. Figure 5.     Photos of different geomorphology types within Virgin Islands National Park.

Skip Footer Information [an error occurred while processing this directive]