Figure 5 A-H.

A) A view of Trunk Bay from the east, very high vulnerability.
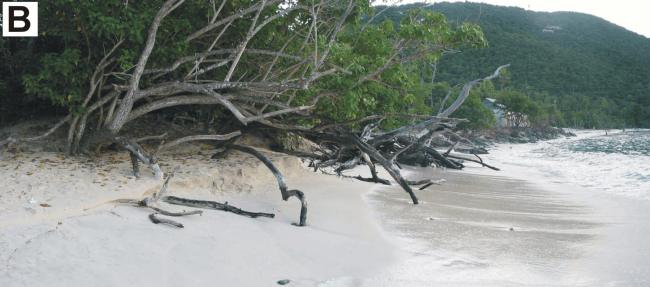
B) The shoreline at Cinnamon Bay is experiencing erosion, very high vulnerability.

C) A view of Maho Bay from the east, very high vulnerability.
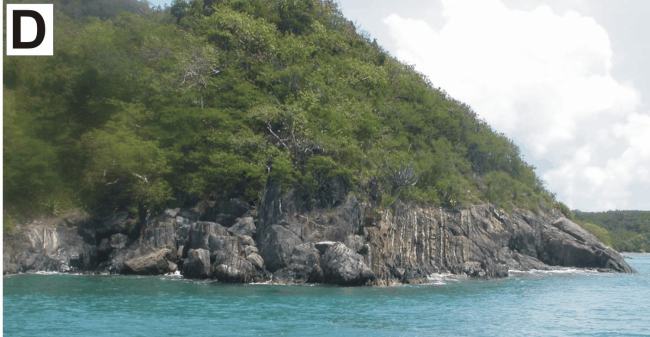
D) Mary Point is ranked as low vulnerability (photo by Rebecca Beavers).
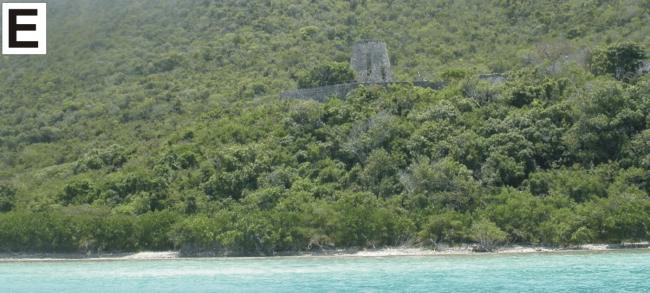
E) The Annaberg Mill ruins are in an area ranked as high vulnerability with respect to geomorphology (photo by Rebecca Beavers).
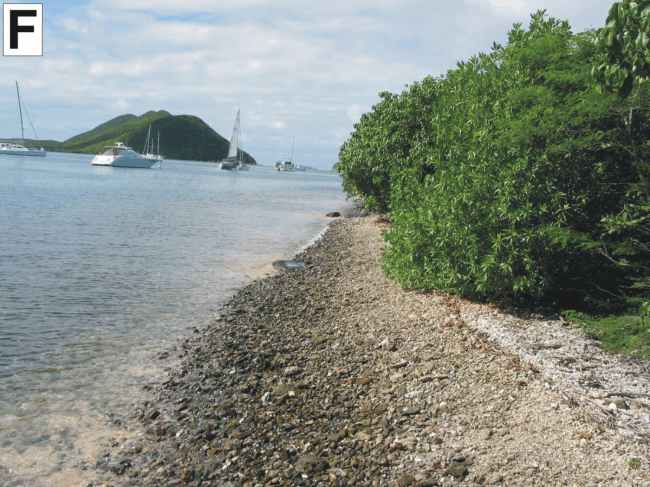
F) The shoreline surrounding Waterlemon Bay is a cobble beach, high vulnerability
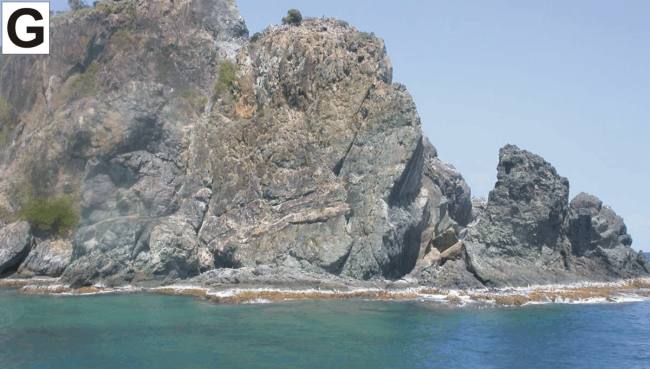
G) Ram Head is a rocky headland, low vulnerability (photo by Rebecca Beavers).
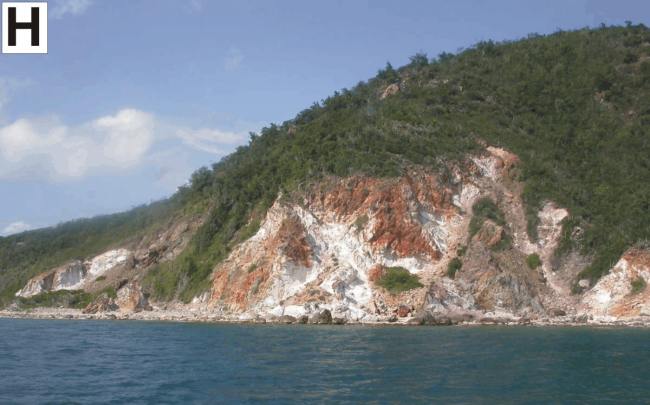
H) The white cliffs near Reef Bay are ranked as low vulnerability (photo by Rebecca Beavers).
|