
Coastal Vulnerability Assessment of Virgin Islands National Park to Sea-Level Rise, USGS Open-File Report 2004-1398
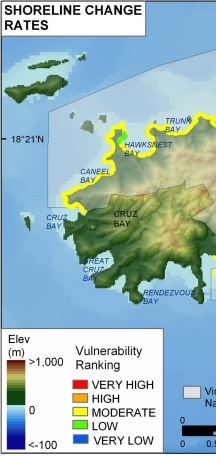
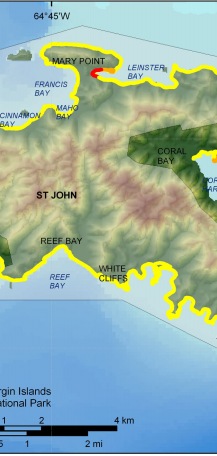
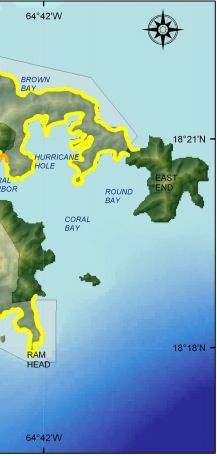
Figure 6. Shoreline change rates for Virgin Islands National Park. The colored shoreline represents the rate of shoreline erosion or accretion. Most of Virgin Islands National Park is moderate vulnerability (-1m/yr - +1m/yr) with respect to shoreline change, there are a few small sandy areas of locally higher erosion rates. | ||
 |
 |
 |
