
Coastal Vulnerability Assessment of Virgin Islands National Park to Sea-Level Rise, USGS Open-File Report 2004-1398
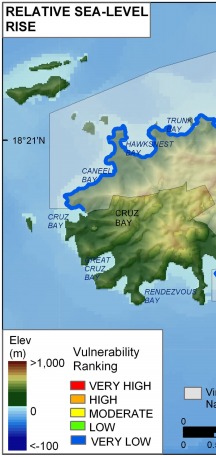
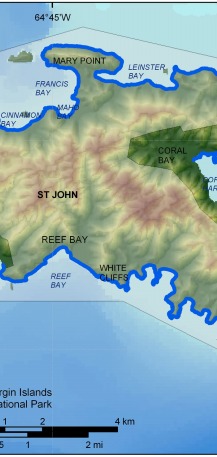
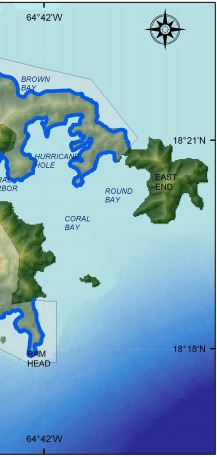
Figure 8. Rate of relative sea-level rise for Virgin Islands National Park. The colored shoreline represents the ranked rate of rise for Charlotte Amalie, St. Thomas. All of Virgin Islands National Park is ranked as very low vulnerability with respect to relative sea-level rise. | ||
 |
 |
 |
