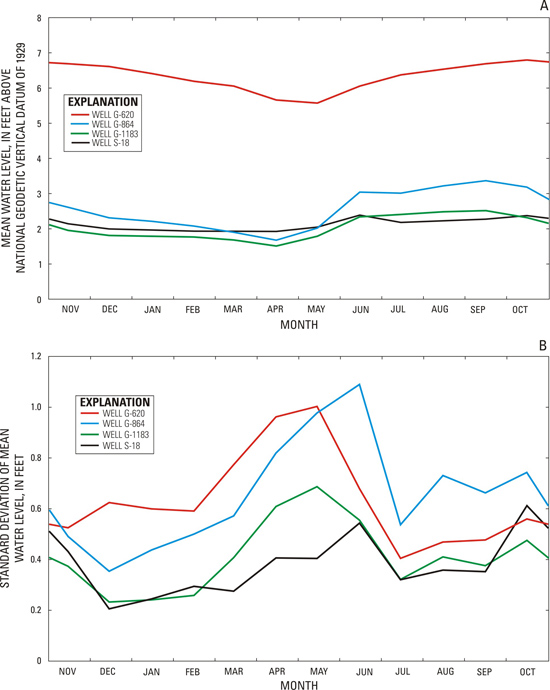
Figure 4.
Graphs showing seasonal variation in mean water levels and variation in monthly standard deviation of mean water levels for wells
G-620
,
G-864
,
G-1183
, and
S-18
.
close window