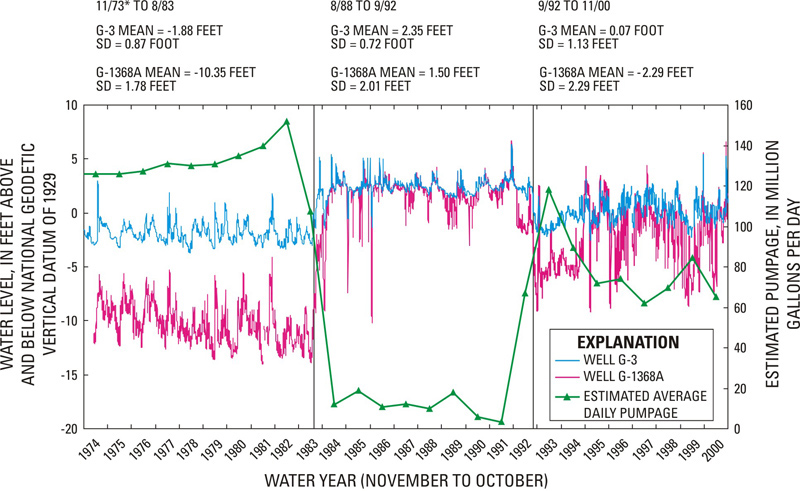
Figure 5.
Hydrograph showing variation in water levels at wells
G-3
and
G-1368A
along with estimated average daily pumpage based on annual pumpage totals during water years 1974-2000.
close window