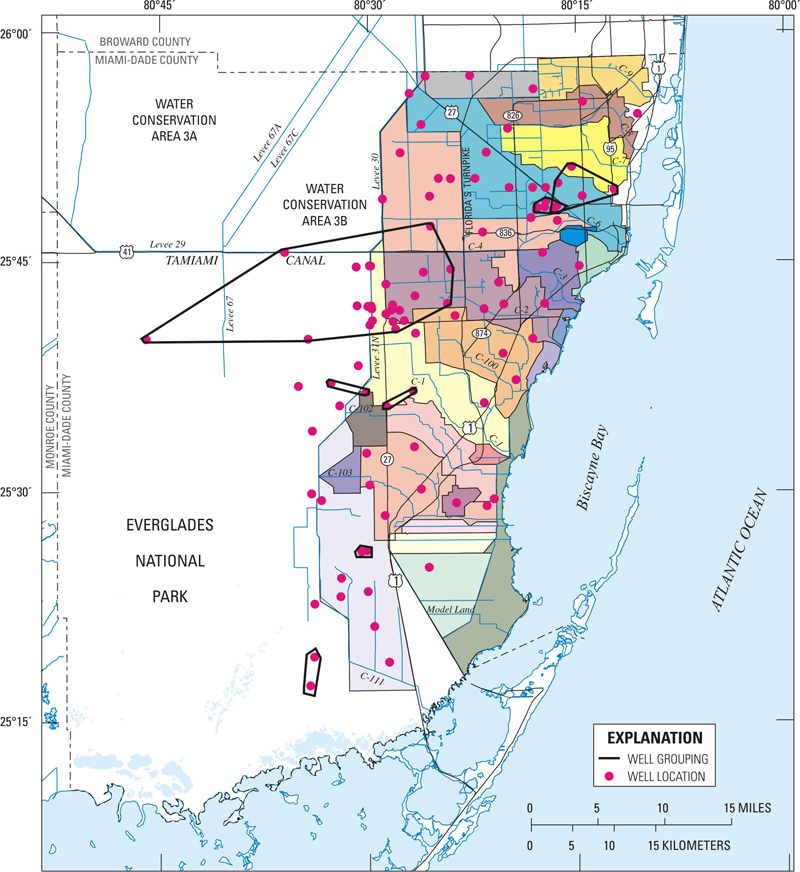
Figure 7.
Map showing grouping of wells based on average correlation of water-level data during the wet season.
close window